Ad Hoc Views allow you to visualise and analyse the data you capture for your organisation.
Ad Hoc Views can be viewed in the Community BI system or in reports and dashboard.
Ad Hoc Views allow you to view data in tables, crosstabs or charts.
Instructions
There are a number of steps to create an Ad Hoc View.
Each step below contains links to an article with more information.
Step 1. Log in to your Community BI system (refer to Logging In for further information).
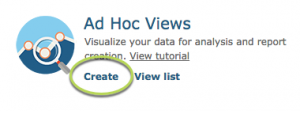
Step 2. Create your Ad Hoc View
Step 3. Select the data source for your Ad Hoc View
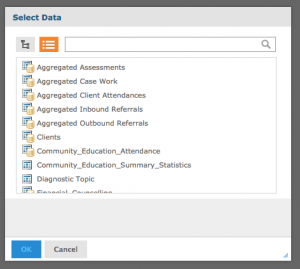
Step 4. Select the data for your Ad Hoc View
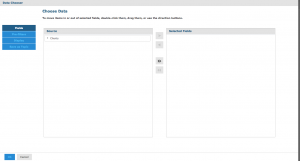
Step 5. Select your Ad Hoc View Type
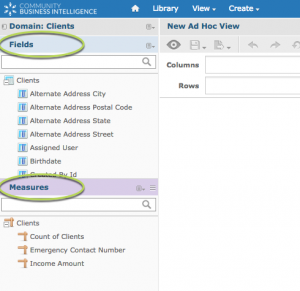
Step 5. Select the fields and measures to display in your Ad Hoc View
Step 6. Configure any additional settings for your Ad Hoc View
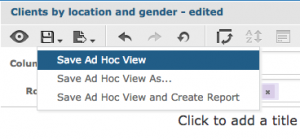
Step 7. Save your Ad Hoc View
Step 8. Use your Ad Hoc View
Ad Hoc View Design Window
The Ad Hoc View Design window is where you will design your Ad Hoc view.
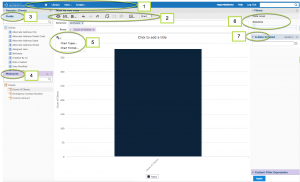
- Community BI Menu Bar
- Use the Menu Bar to navigate the Community BI system, and to create new items
- Ad Hoc View Design menu
- Use the Ad Hoc View Design menu to manage the current Ad Hoc View
- Fields pane
- Use the Fields pane to select fields and create filters and calculated fields
- Measures pane
- Use the Measures pane to select measures and create filters and calculated measures
- Chart Options (only available when Chart type selected)
- Use the Chart Options to select Chart types and format your chart
- Data Level Slider (only available when Chart type selected)
- Use the Data Level slider to adjust the data level of your chart
- Filters pane
- Use the filters pane to configure your added filters
Further Information
For more information on Ad Hoc Views, refer to the following
- Ad Hoc Views articles
- Ad Hoc Views – Charts articles
- Which Ad Hoc View Should I Use? article