Crosstabs have different data, layout and format options than tables or charts.
Crosstabs are similar to Pivot Tables that you may have used in other systems.
Ad Hoc Views allow you to visualise and analyse the data you capture for your organisation.
Ad Hoc Views can be viewed in the Community BI system or in reports and dashboard.
Instructions
Step 1. Create a new ad hoc view (refer to the Creating Ad Hoc Views article for further information)
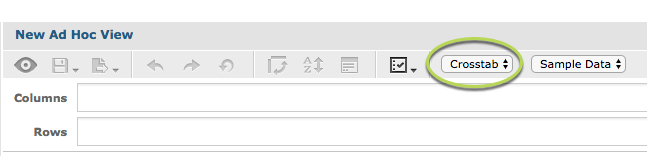
Step 2. Select Crosstab from the drop-down at the top of the screen
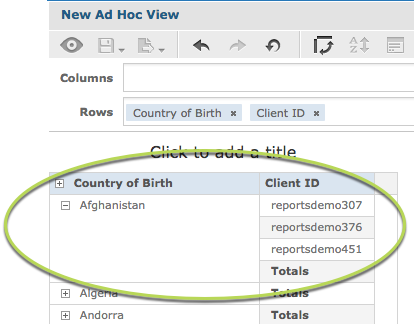
Step 3. Click and drag a required field from list on the left to the Rows area.
E.g Client ID
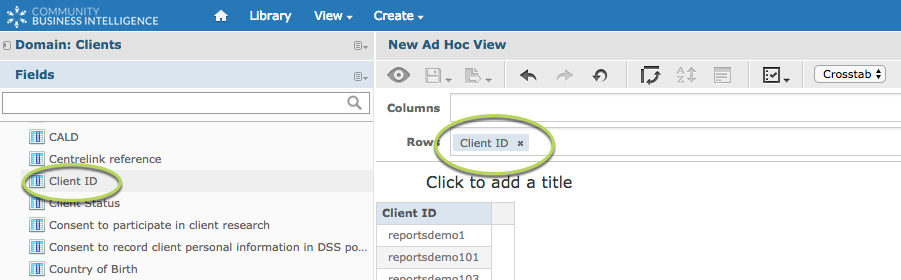
This will display a simple list of the field selected. (Client ID)
Step 4. To group the information, click and drag the required group field into the Columns area.
E.g. Country of Birth
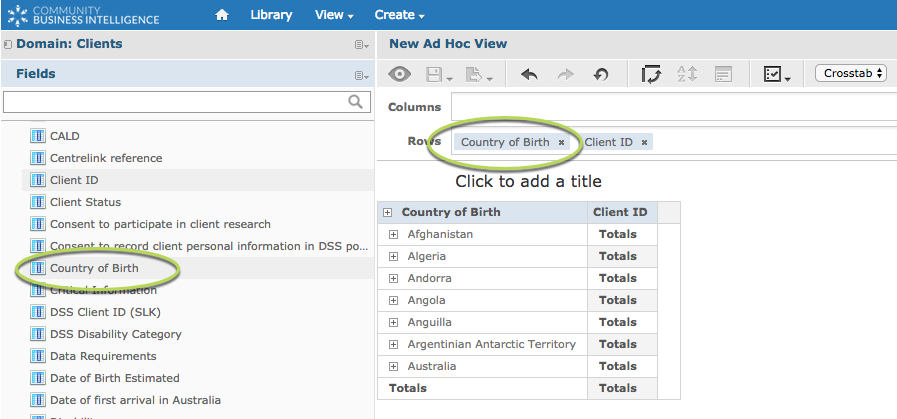
The data will now be grouped by the selected field (Country of Birth)
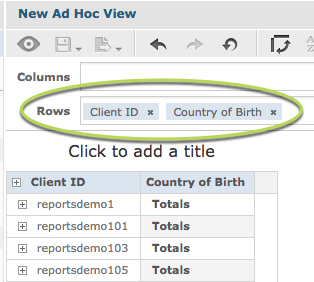
Tip: With crosstabs, the grouping is hierarchical. The change the grouping levels, change the order of the fields in the rows or columns – see below
Step 5. Click on the plus next to one of the groups to expand the group members.
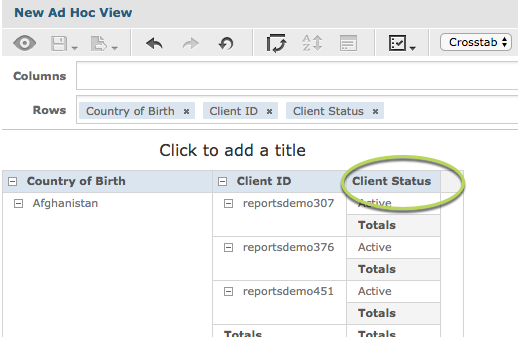
To add more information, drag another field into the Rows area. (e.g. Client Status). Adding the field to Rows will create another, lower level group
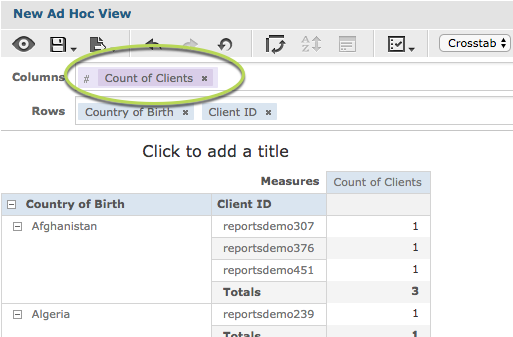
Step 6 – Measures are generally a numerical or calculated field that can be added for further information. (e.g. count of clients)
Add a measure to the Columns area of the crosstab e.g. Count of Clients
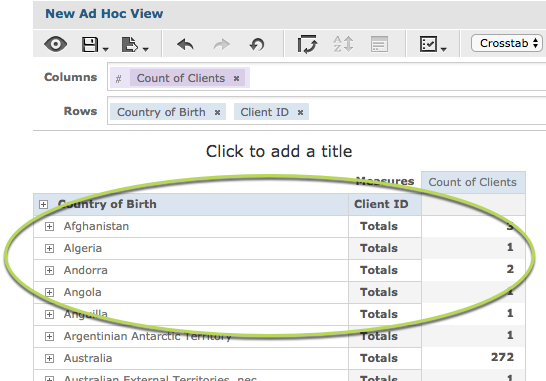
If you collapse the Country of Birth groups, the number of clients for each Country will be displayed.
Step 7. Add another Field to the Columns area
e.g. Gender
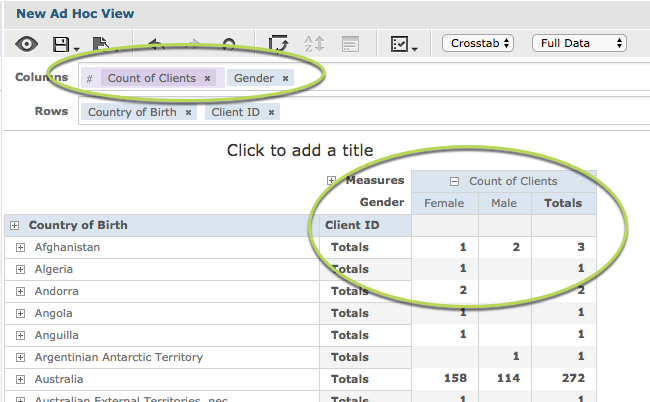
This will split the client count into the reported genders.
Tip: Remember to expand the measures if the different values are not appearing.
Step 8. If required, add additional measures to your crosstab e.g. Income Amount
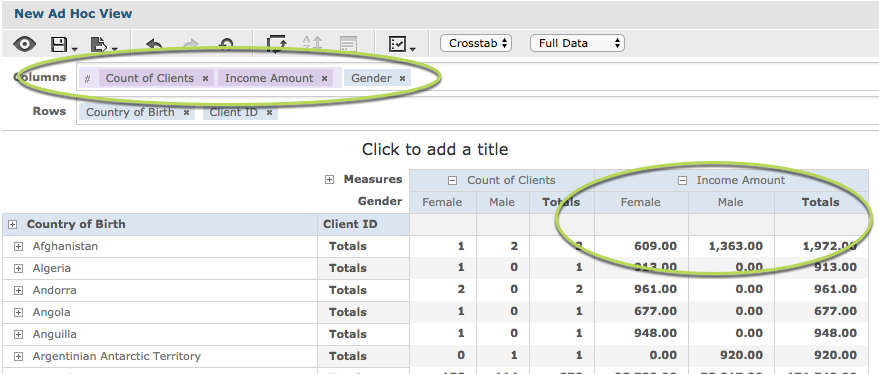
Tip: while editing your ad hoc view will only use sample data to ensure quicker response times.

To display full data select it from the drop down at the top of the page.
Further information
Next step – Saving your view
Refer to the following articles for further information
For more information on Ad Hoc Views, refer to the following articles: