Ad Hoc Views allow you to visualise and analyse the data you capture for your organisation.
Ad Hoc Views can be viewed in the Community BI system or in reports and dashboard.
Ad Hoc Views allow you to view data in tables, crosstabs or charts.
Instructions
Step 1. Log in to your Community BI system (refer to Logging In for further information).
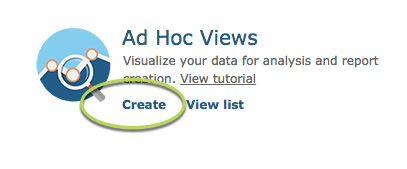
Step 2. From the home page, select Create > Ad Hoc View, or click the Create button in the Ad Hoc View section of the home page

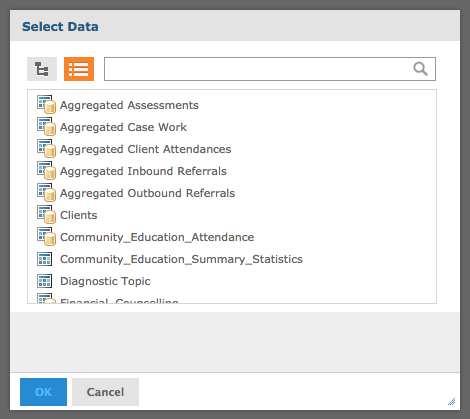
Step 3. Select the domain (data structure) you are interested in viewing.
Click Choose Data …
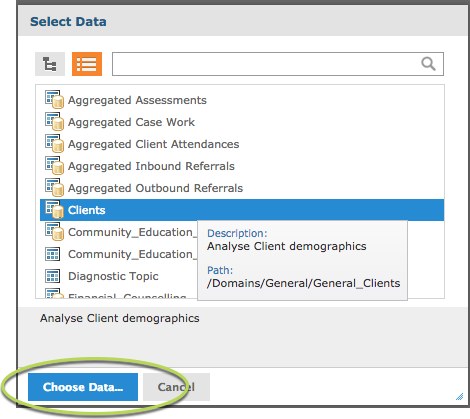
Step 4. Select the data source within the domain.
Tip: use the arrow next to the source name to display all fields
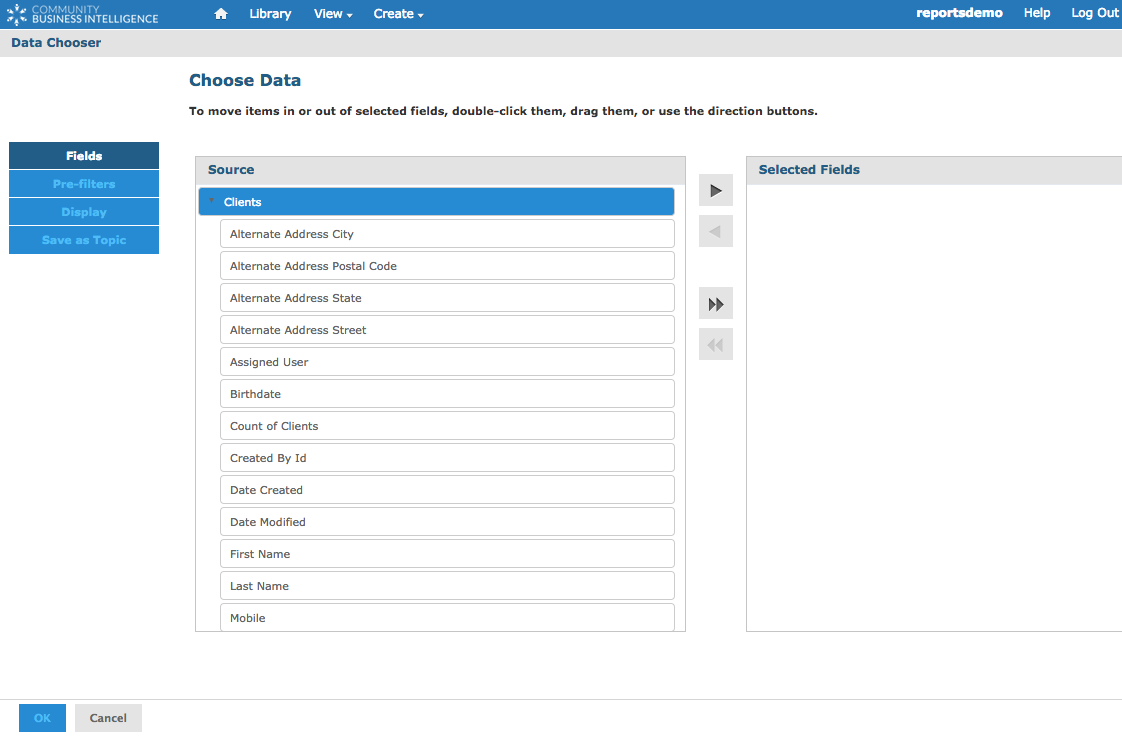
Tip: You can choose to include all fields within a domain,
or just the ones you are interested in
Highlight the required field(s) and press the Single Arrow to select individual fields
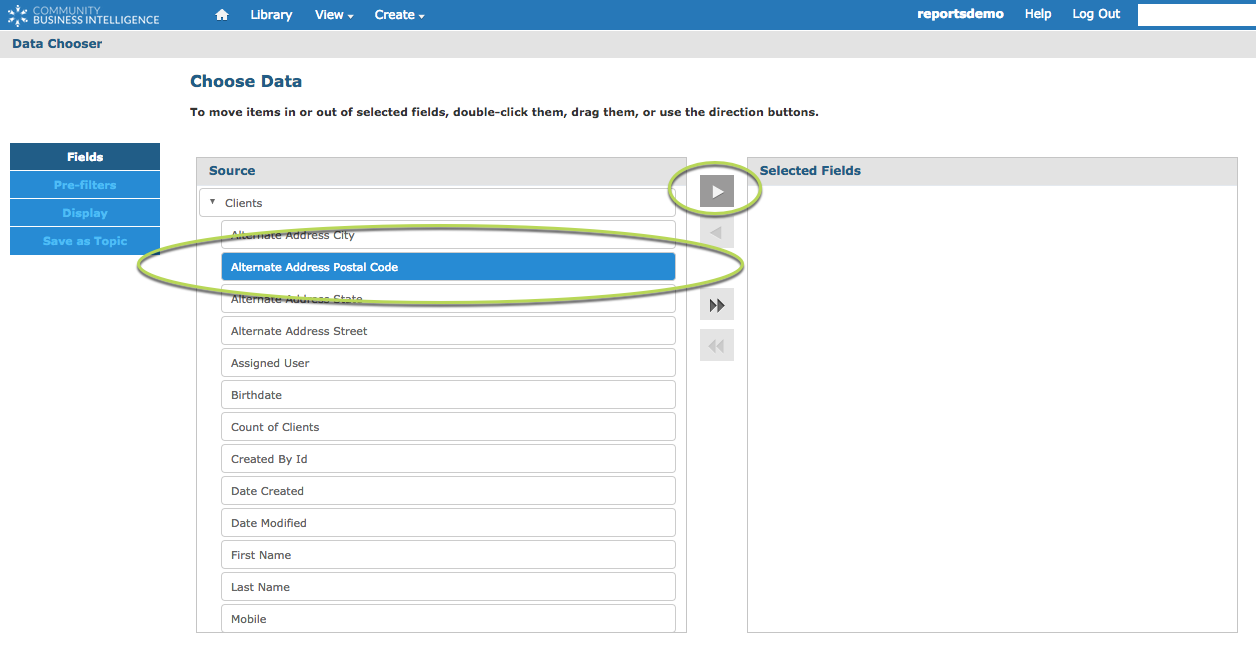

Or
Press the double arrow to select all fields
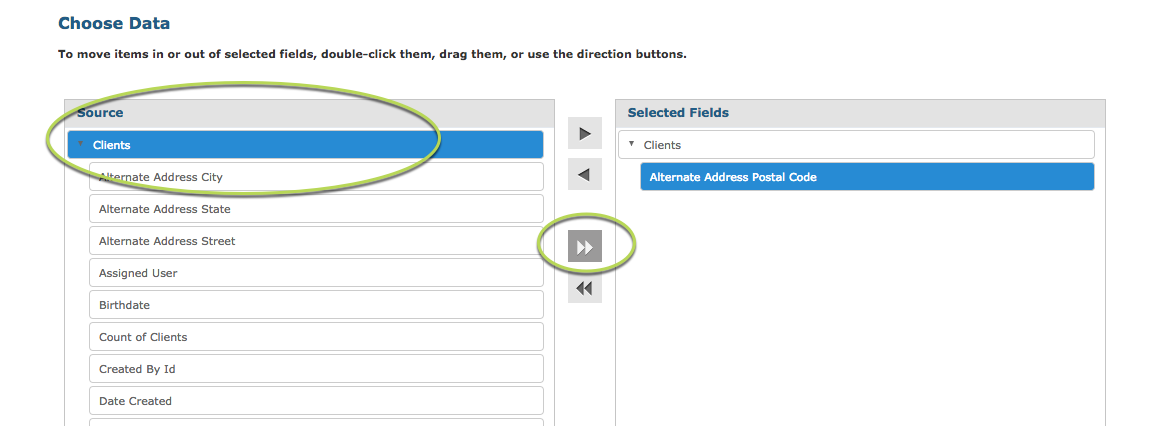
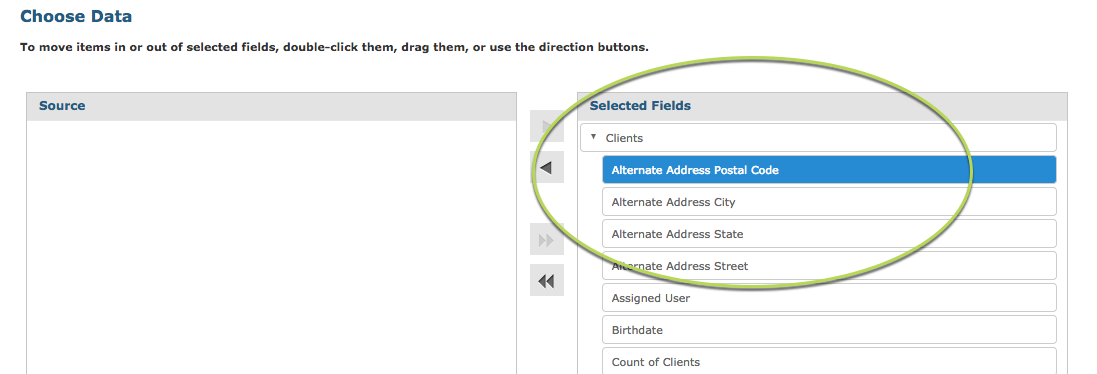
Step 5. Press OK
Further Information
See the following articles for instructions on how to create the different types of Ad Hoc Views
