Charts allow you to graphically display your data you have captured in your Community BI system. There are a number of different chart types available, including Column, Bar, Pie and Spider.
Deciding on which chart to use can be confusing, and certain charts may have different data requirements.
Choosing the right chart will help you share your information.
Information
With so many options to choose from it can be difficult to select the best chart for your data.
It is important to think about what information you need and how it is going to be used.
Determine which fields contain the data you are interested, then you can decide which chart will display them best.
Chart Types
When you select the Chart Types Option from the Ad Hoc View Editor the following Select Chart Type window is displayed:
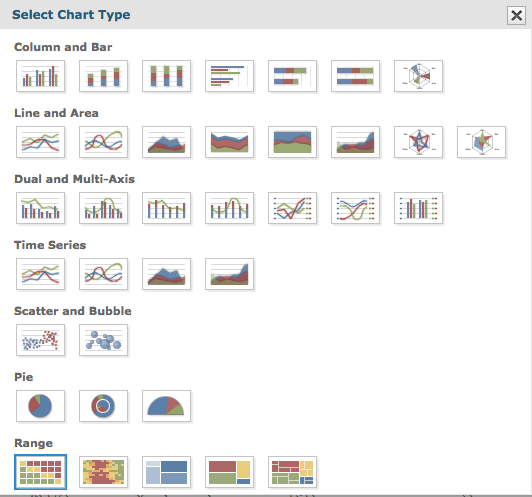
There are a number of charts under each chart group.
One or more examples from each group are displayed below.
Please refer to the dedicated chart type articles for more information.
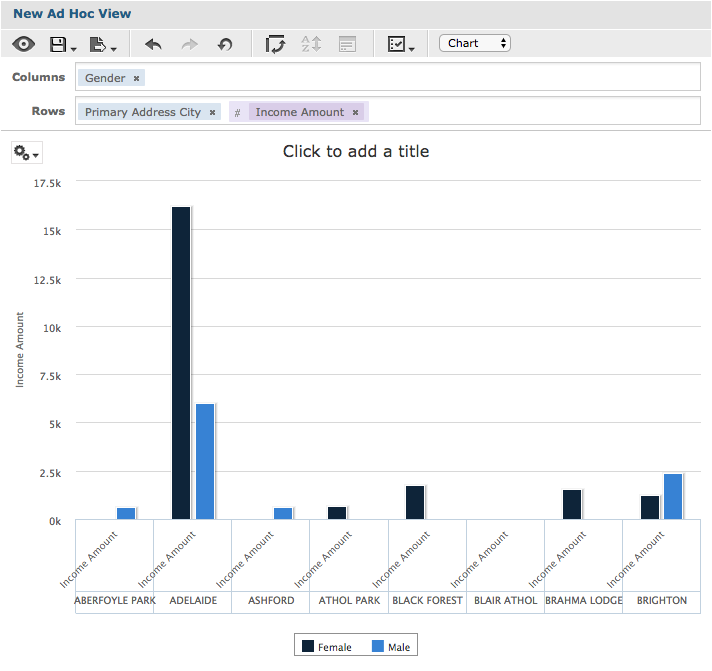
Column
Column charts compare values displayed as columns
For information on creating a Column Chart, refer to one of the following articles:
- Ad Hoc View – Column Chart
- Ad Hoc View – Stacked Column Chart
- Ad Hoc View – Percent Column Chart
- Ad Hoc View – Spider Column Chart
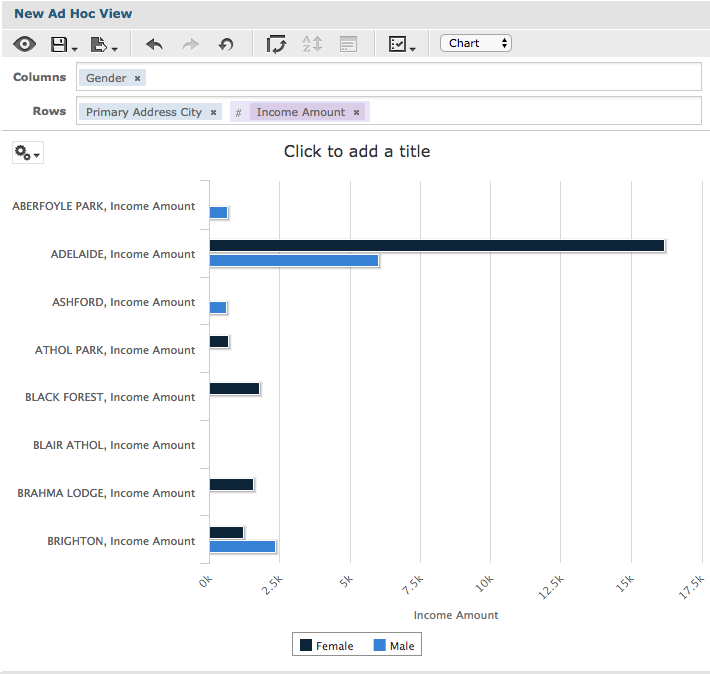
Bar
Bar charts compare values displayed as bars
For information on creating a Bar Chart, refer to one of the following articles:
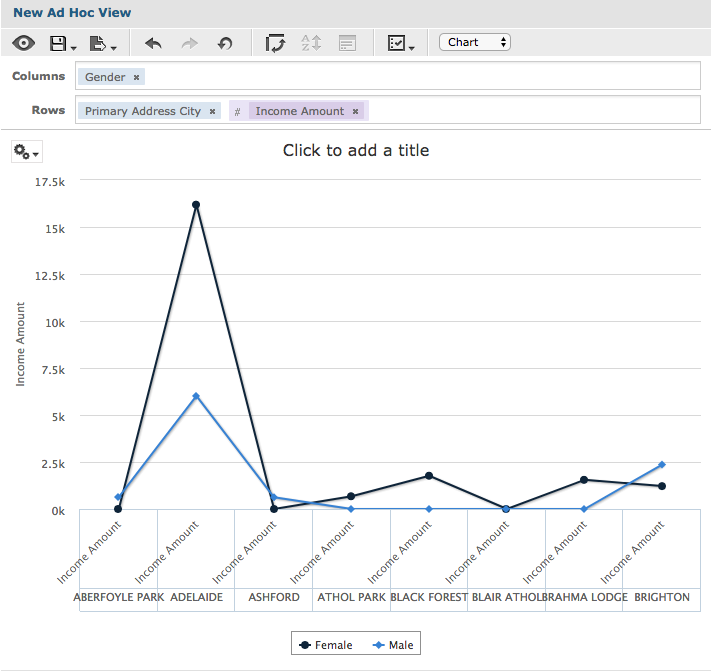
Line
Line charts compare values displayed as points connected by lines
For information on creating a Line Chart, refer to one of the following articles:
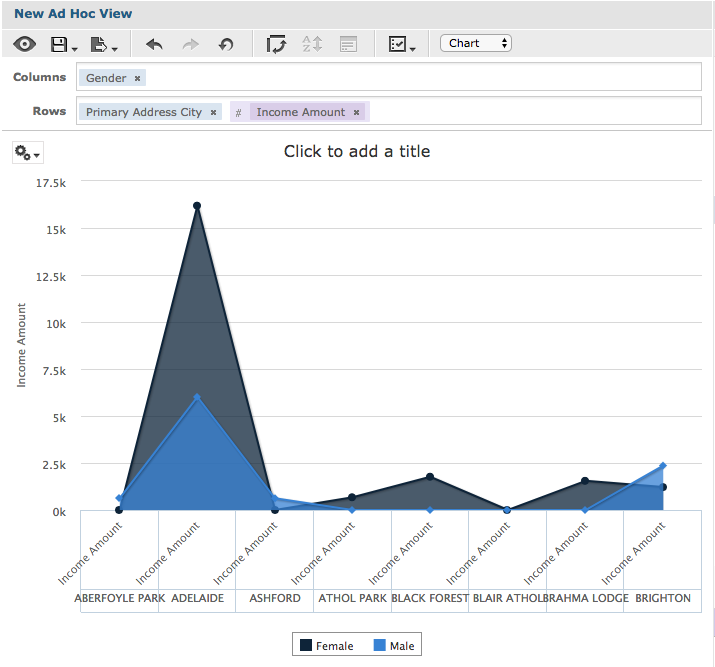
Area
Area charts compare values displayed as points connected by lines with a colour below the line.
For information on creating a Pie Chart, refer to one of the following articles:
- Ad Hoc View – Area Chart
- Ad Hoc View – Stacked Area Chart
- Ad Hoc View – Percent Area Chart
- Ad Hoc View – Area Spline
- Ad Hoc View – Spider Area
Dual-Axis
Dual-Axis charts compare two or more measures, using one or multiple charting types. E.g. column chart with one measure as a line
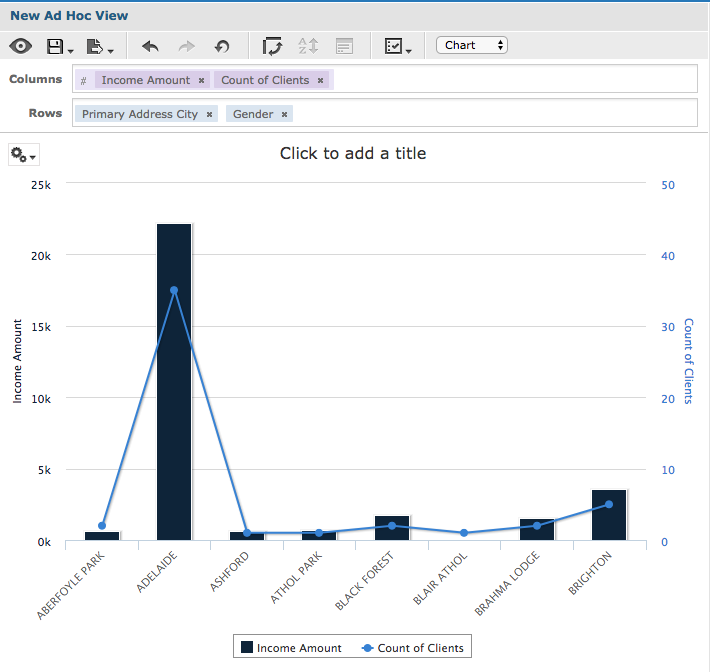
Dual-Axis charts require at least 2 (Column line/spline) or 3 (stacked column line/spline) measures. Measures must be placed in columns. Fields must be placed in rows.
For information on creating a Dual-Axis Chart, refer to one of the following articles:
- Ad Hoc View – Column Line Chart
- Ad Hoc View – Column Spline Chart
- Ad Hoc View – Stacked Column Line Chart
- Ad Hoc View – Stacked Column Spline Chart
Multi-Axis
Multi-Axis charts compare two or more measures as separate access lines, or separate axis columns
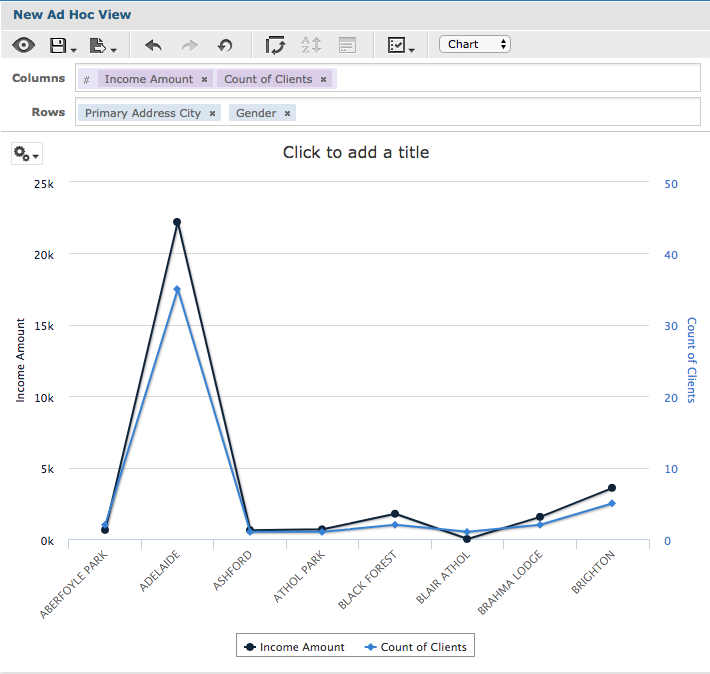
Multi-Axis charts require at least 2 measures. Measures must be placed in columns. Fields must be placed in rows.
For information on creating a Multi-Axis Chart, refer to one of the following articles:
- Ad Hoc View – Multi-Axis Line Chart
- Ad Hoc View – Multi-Axis Spline Chart
- Ad Hoc View – Multi-Axis Column Chart
Time Series
Time Series charts illustrate data points at successive time intervals
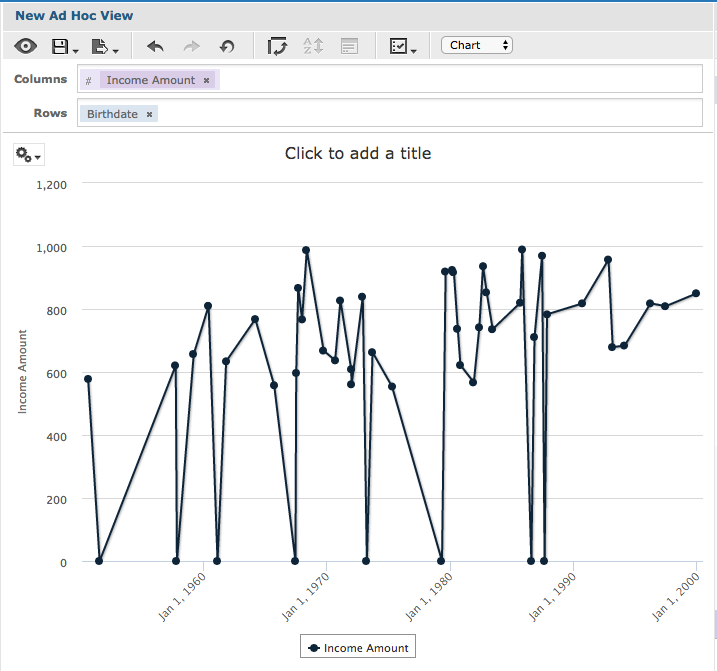
Time charts require a single date/time field in rows. Field must be set to the ‘day’ group function.
For information on creating a Time Series Chart, refer to one of the following articles:
- Ad Hoc View – Time Series Line Chart
- Ad Hoc View – Time Series Spline Chart
- Ad Hoc View – Time Series Area Chart
- Ad Hoc View – Time Series Area Spline Chart
Scatter
Scatter charts show the extent of correlation between two measures
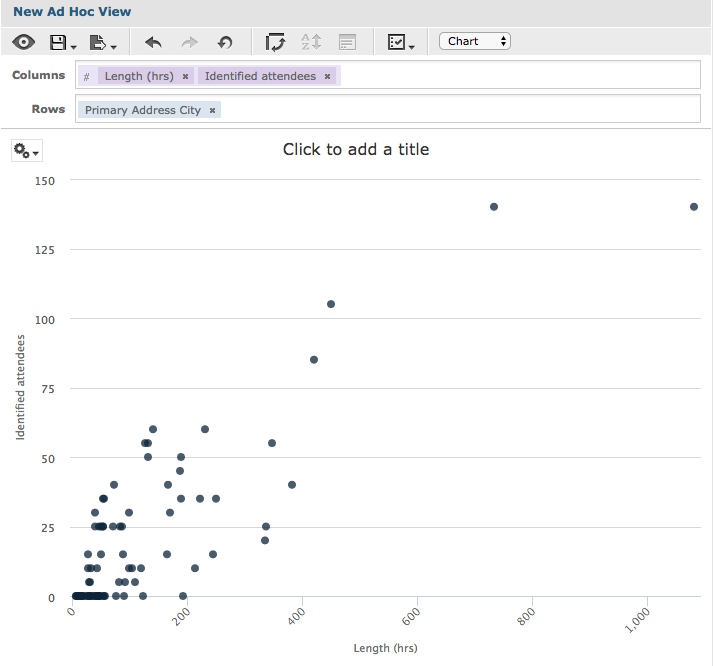
Scatter charts must have exactly 2 measures.
Measures must be in columns.
For information on creating a Scatter Chart, refer to the following articles:
Bubble
Bubbles charts show the correlation between three measures
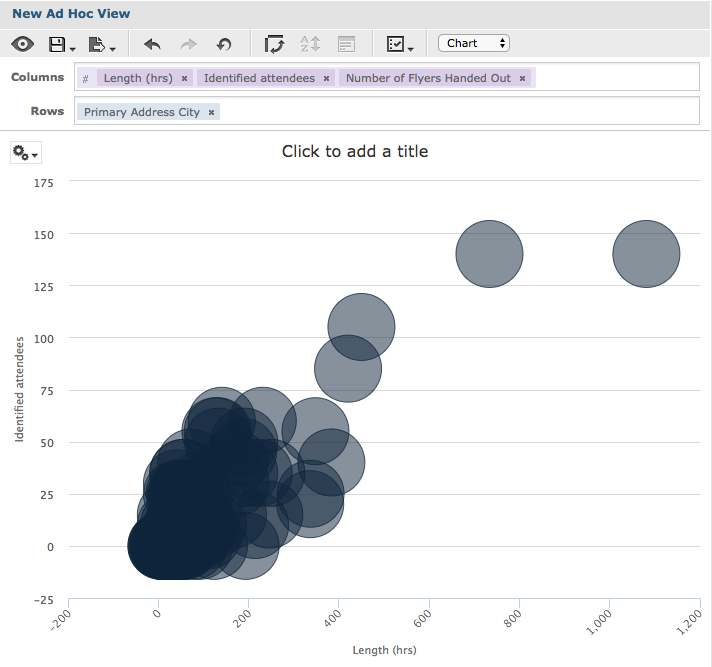
Bubble charts must have exactly 3 measures. Measures must be in columns.
For information on creating a Bubble Chart, refer to the following articles:
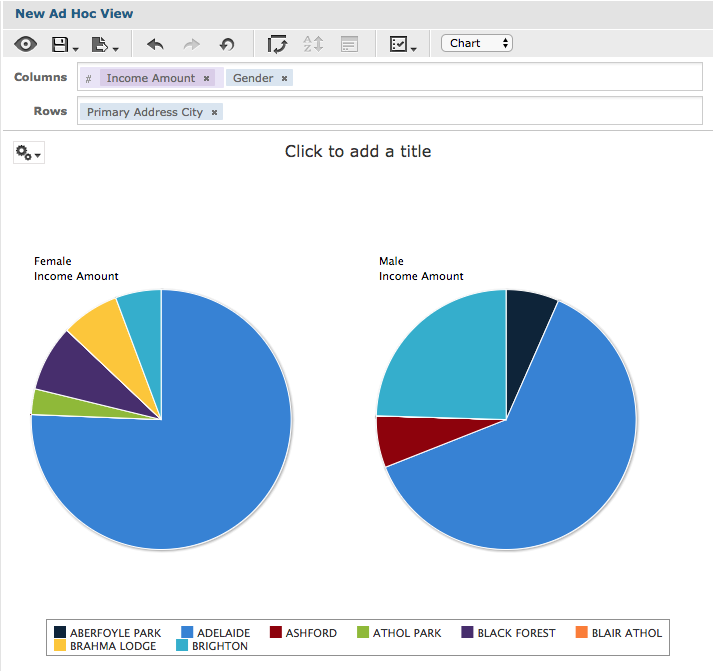
Pie
Pie charts display values as slices of a circular (or semi-circular) chart
For information on creating a Pie Chart, refer to one of the following articles:
Range
Range chart display values heat maps
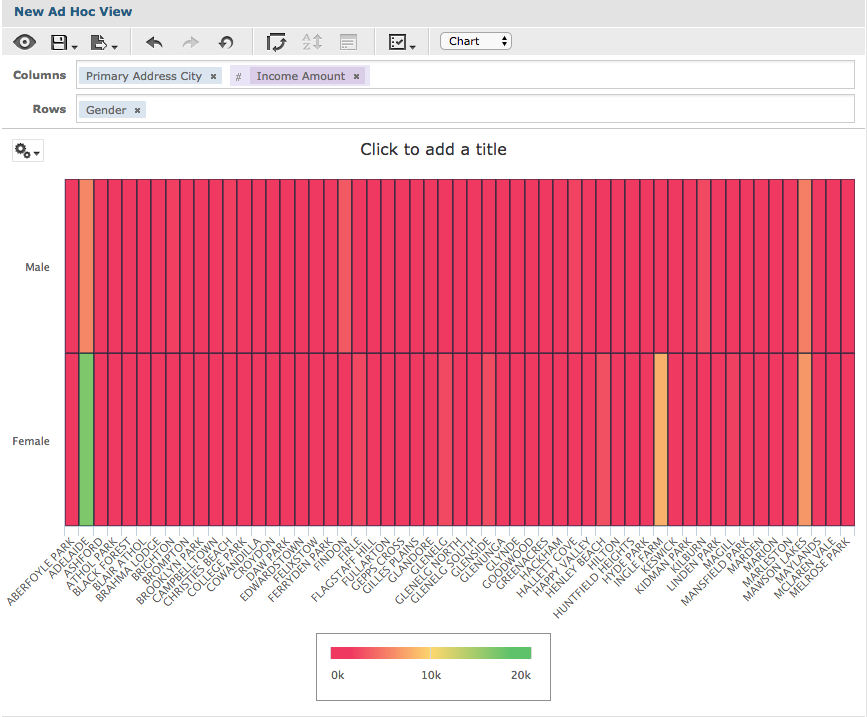
Range charts have additional requirements for rows (field) and columns (measures).
For information on creating a Range Chart, refer to one of the following articles:
- Ad Hoc View – Heat Map
- Ad Hoc View – Time Series Heat Map
- Ad Hoc View – Dual Measure Tree Map
- Ad Hoc View – Tree Map
- Ad Hoc View – Parent Tree Map
You may have noticed that the majority of the examples above use the same information:
Gender, Primary Address City and Income Amount are used for the following charts:
- Column
- Bar
- Line
- Area
- Pie
- Range
Count of Clients was added to the following:
- Dual-Axis
- Multi-Axis
This demonstrates how the same information can be displayed in very different ways. It is worth trying out the different charts to see which one best helps with your analysis.
Try moving your fields from columns to rows or groups to find the best representation of your data.