Gauge Charts display a total measure represented on a dial or gauge. The gauge can be configured to show progress towards a maximum figure or target.
Charts allow you to graphically display your data. There are a number of different chart types available.
Instructions
Step 1. Open or create a new ad hoc view (refer to the Creating Ad Hoc Views article for further information)
Step 2. Click on the Select Visualisation Type icon in the top menu
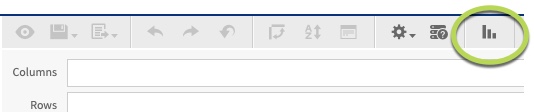
The Select Visualisation Type window is displayed
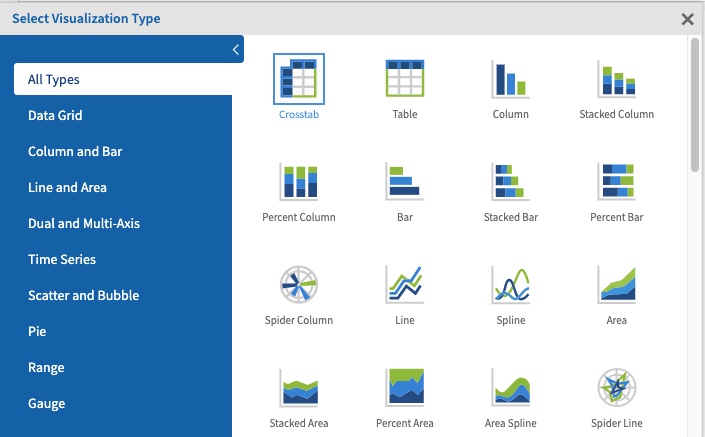
Step 3. Select the required chart type from the list.
You can select a category on the left to narrow down the list.
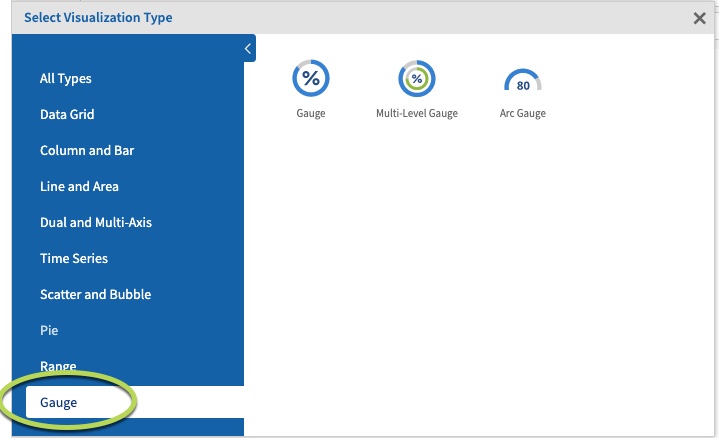
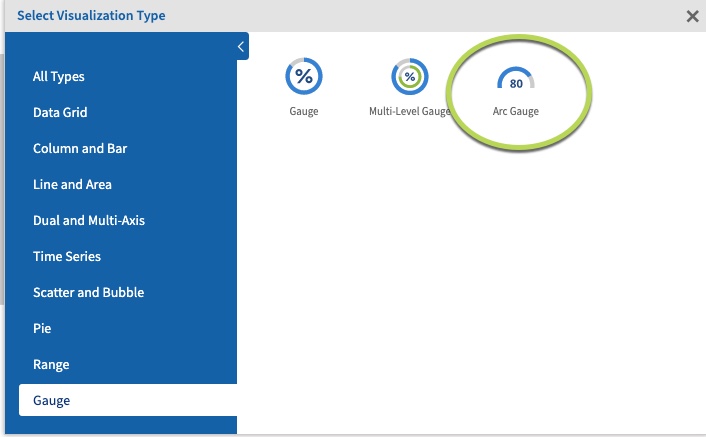
Step 4. Click on Gauge to select the Gauge chart.
Tip: The Gauge Chart requires at least one measure and any fields to be in the Columns location
Step 5. Add a measure into the Columns area from the measures area on the left hand side pane.
e.g. Count (Clients)
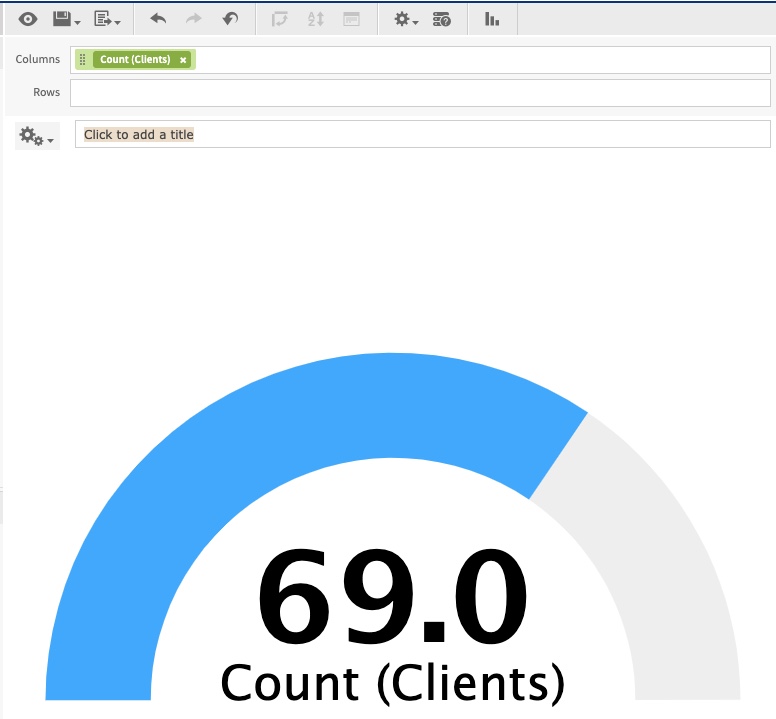
As there are no fields selected, the total for the selected measure is displayed.
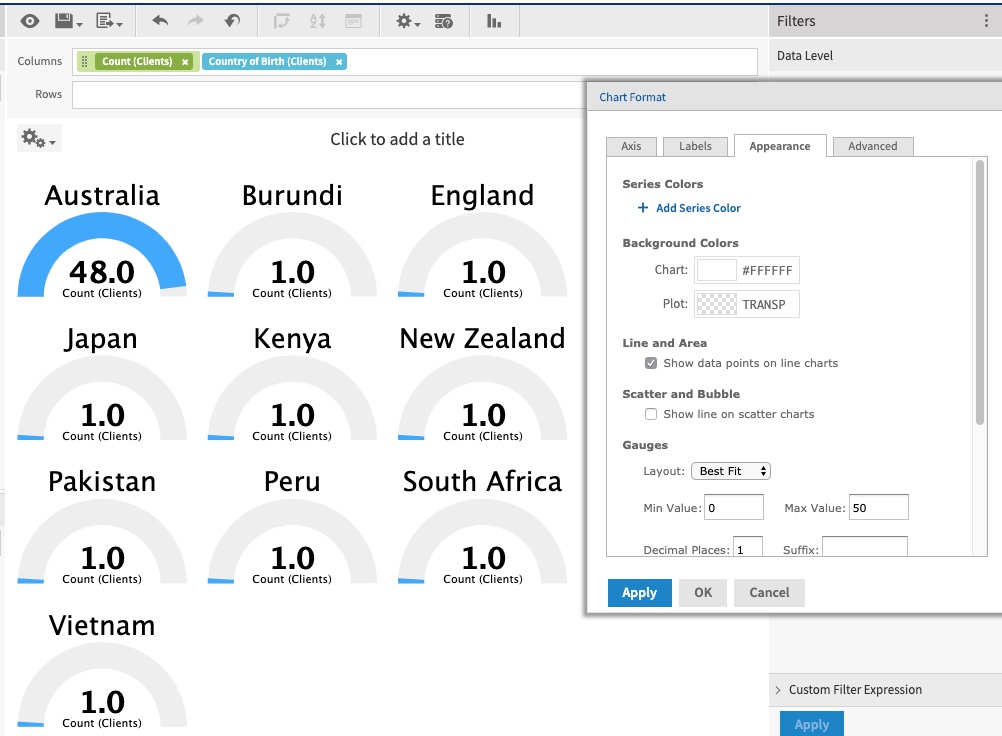
Step 6. To break the measure further, add fields to the columns section.
e.g. Country of Birth
You’ll notice when the field is added that the chart may not change.
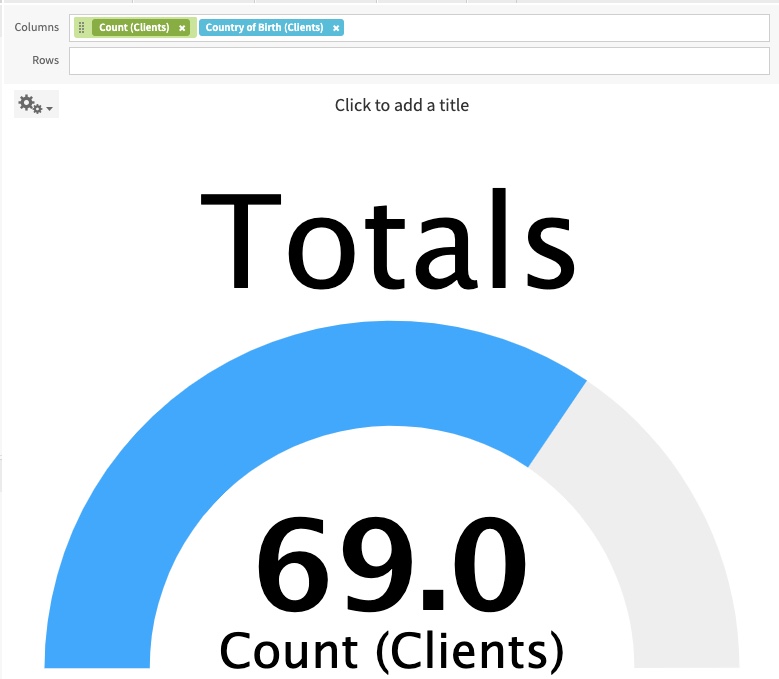
In the right-hand side pane there is a section caller Data Level.
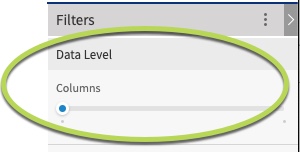
The slider allows you to quickly change the level at which the data is reported. When the slider is all the way to the left, it shows the measure total.
Step 7. Slide the rows slider to the right.
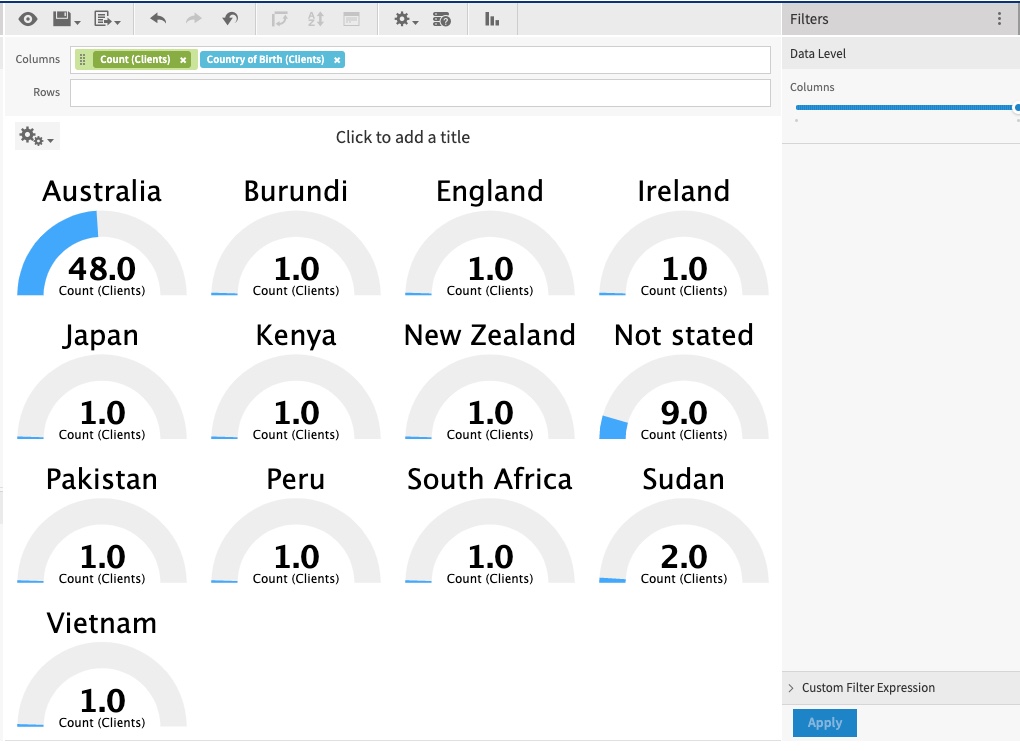
The measures are now split by the additional column field (Country of Birth).
If you add additional fields to the rows or columns, the sliders will update and the measures will be split if you move the sliders.
You may find that the chart becomes less useful if you add too many fields.
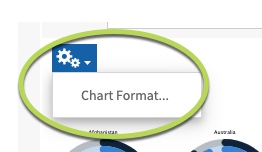
Step 8. If you wish to change the scale of the gauge chart, you can set the Min and Max value for the gauge.
Click the cog wheel (chart format) icon, then click Chart Format.
Step 9. Select the Appearance Tab
Review the Min Value and Max Value
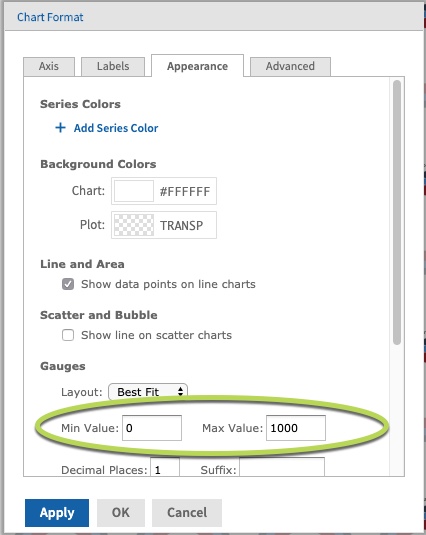
Update the Min Value and Max Value entries to change the scale of the gauge.
Step 10. Click Apply to review the change
Step 11. If you are happy with the new scale, click OK and save the ad hoc view.
Further Information
For further information on Ad Hoc Views and Charts, refer to the following articles: