Tables allow you to view a simple representation of data fields and measures. Tables are also an easy way to retrieve lists of information.
Ad Hoc Views allow you to visualise and analyse the data you capture for your organisation.
Ad Hoc Views can be viewed in the Community BI system or in reports and dashboard.
Instructions
Step 1. Create a new ad hoc view (refer to Creating Ad Hoc Views for further information)
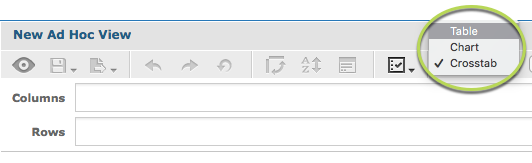
Step 2. Select Table from the drop down at the top of the screen
Step 3. Click and drag a required field from list on the left to the columns area.
E.g Client ID
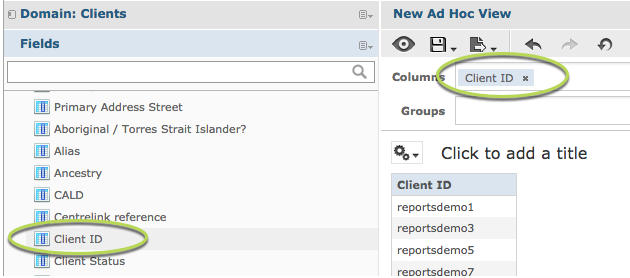
This will display a simple list of the field selected. (Client ID)
Step 4. To group the information, click and drag the required group field into the Groups area.
E.g. Country of Birth
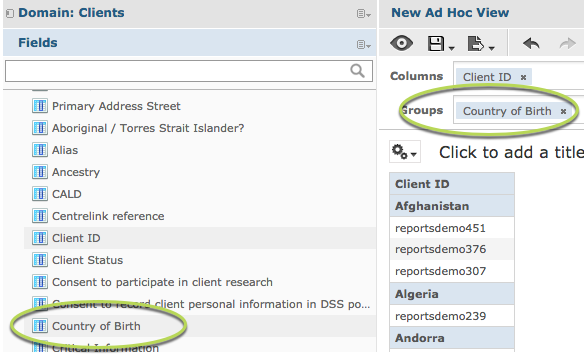
The data will now be grouped by the selected field (Country of Birth)
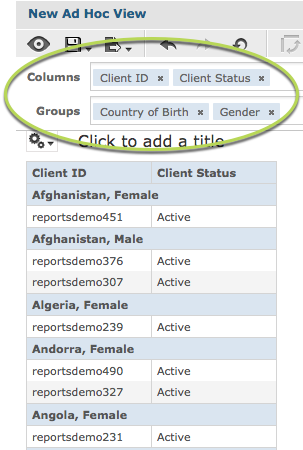
Step 5. You may wish to add more information to the table.
To add more information, drag another field into the Columns area. (e.g. Client Status)
To add another grouping, drag another field into the Groups area. (e.g. Gender)
Step 5. Measures are generally a numerical or calculated field that can be added for further information.
(e.g. income amount)
To add a measure, drag and drop from the measures area into the Columns area
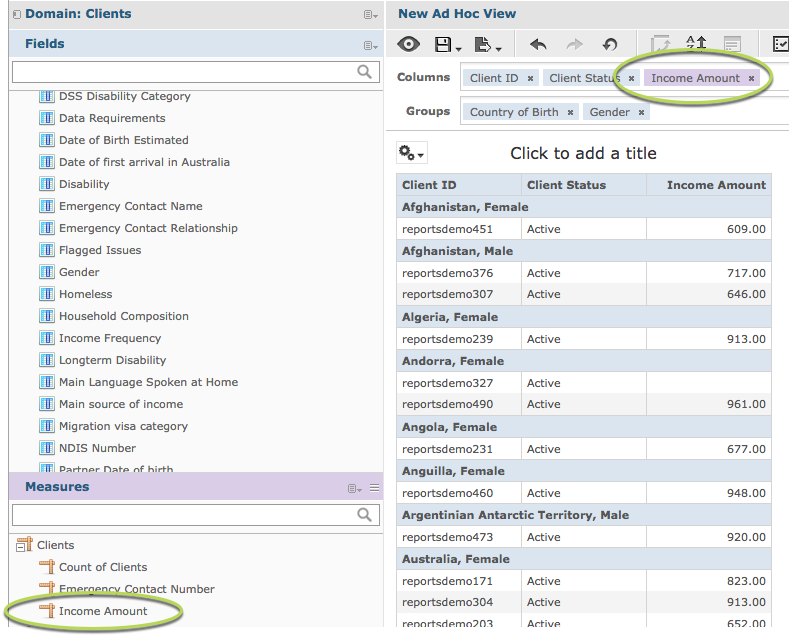
The measure is now displayed in your table.
Tip: while editing your ad hoc view will only use sample data to ensure quicker response times.

To display full data select it from the drop-down at the top of the page.
Further Information
Next step – Saving your view
For further information on Ad Hoc Views, refer to the following articles: