Crosstabs also allow you to filter numeric data based on the top or bottom results.
Crosstabs have different data, layout and format options than tables or charts. Crosstabs are similar to Pivot Tables that you may have used in other systems.
Ad Hoc Views allow you to visualise and analyse the data you capture for your organisation.
Ad Hoc Views can be viewed in the Community BI system or in reports and dashboard.
Instructions
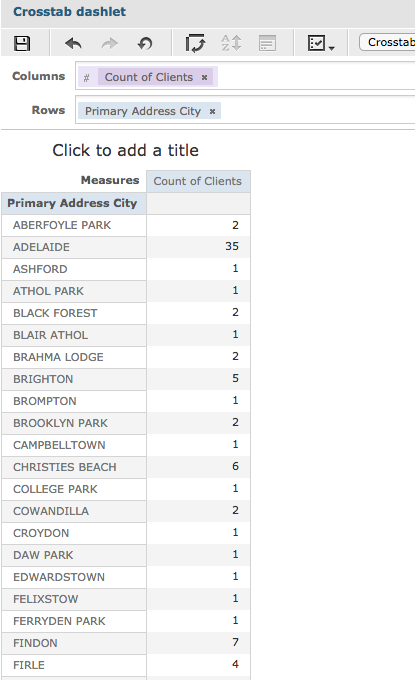
Step 1. Create or open a Crosstab Ad Hoc View (refer to the Ad Hoc View – Crosstab article for further information).
Step 2. Right Click on the measure you wish to filter on.
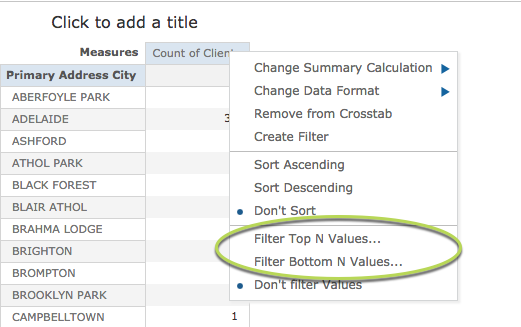
Step 3. Select Filter Top N Values…
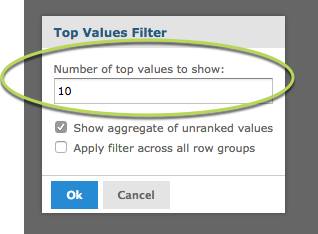
Step 4. Enter the number of top values to show i.e. Top 10, Top 5.
Tip: If the Show aggregate of unranked values check box is selected, all remaining results will be displayed in a group labelled 'Other'.
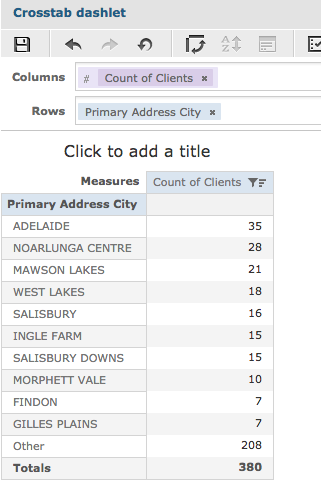
The filtered results are displayed.
Save the changes if required.
Refer to Saving Ad Hoc Views article for further information.
Step 5. To remove the filter, right click on the measures header
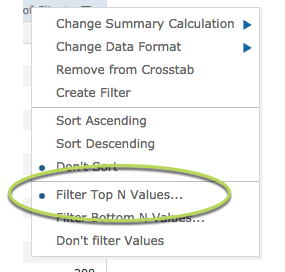
Tip: The blue dot next to the Filter Top N Values... shows that it is currently active
Step 6. Select Don’t filter Values to remove the filter
The filter is removed and all data is displayed.
Further Information
For further information, refer to the following articles: