The following video shows an example of a Migration Summary Crosstab Ad Hoc View.
The Crosstab includes the following information:
- Gender
- Residency Status
- Migration Visa Category
- Count of Clients
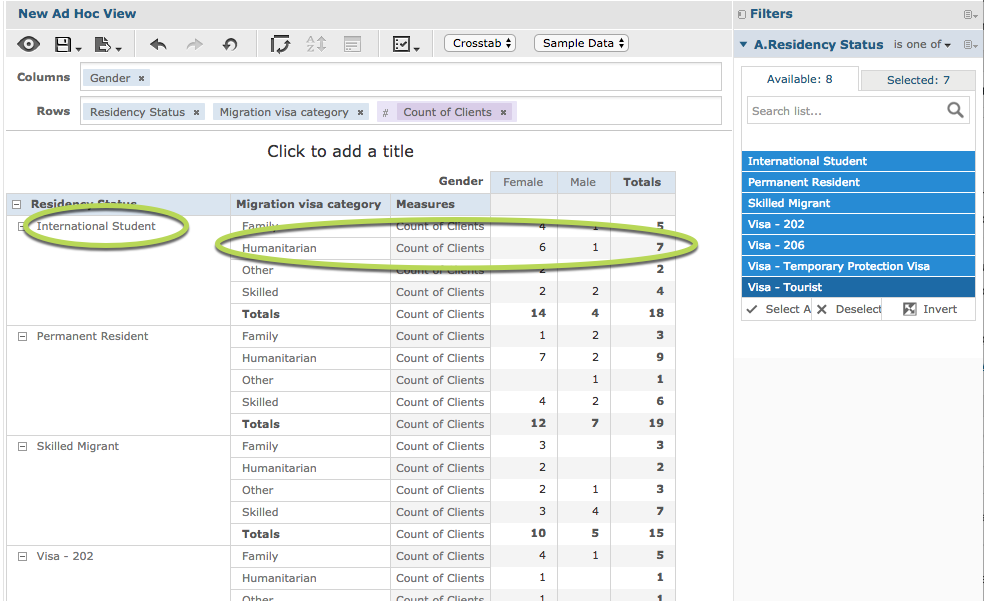
This is a Crosstab view that allows you to quickly view the total number of Clients who have a particular visa and residency status.
The final crosstab is grouped by Residency status and Migration Visa Category so you can quickly view all the International students on Humanitarian Visas.
If you need to see all female Permanent residents with a Family visa, you could move the Migration Visa category to Columns and Gender to Rows. The results would be grouped by Gender, then Residency split into Visa columns (see below)
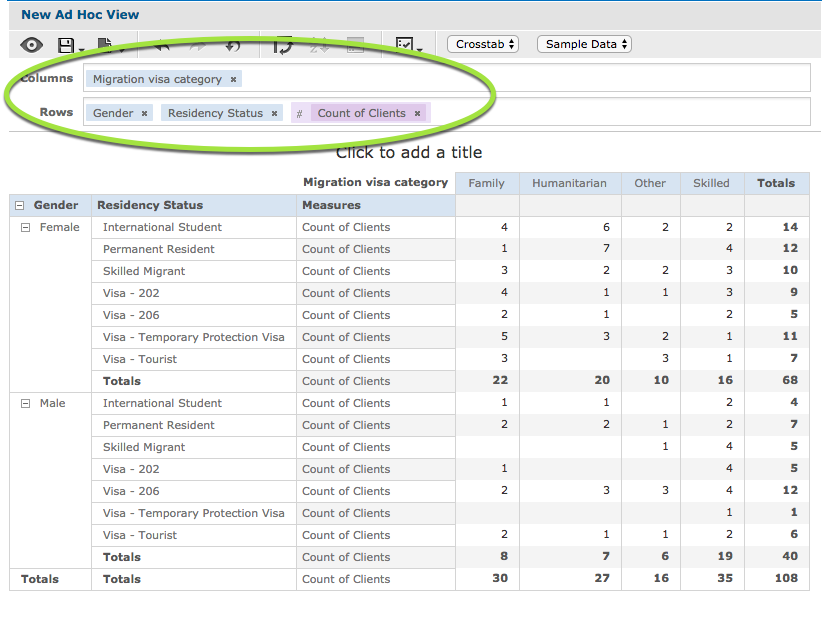
While the data itself remains the same, changing the display location or order splits the figures in different ways.
The Crosstab is useful for counts of measure across a combination of groups, but if you want a more graphic representation, you may find a Chart Ad Hoc View is more useful.
Further Information
For information on creating Crosstab Ad Hoc Views, refer to the following article: