Ad Hoc Views allow you to visualise and analyse the data you capture for your organisation.
As Crosstab Views allow a different display of data than Table views, Sorting and Summaries work differently as well.
Sorting and Summaries allow additional control over the display of your data.
Instructions
Step 1. Open or create a new Crosstab ad hoc view
Refer to the Ad Hoc Views – How to Create article for information on how to create an ad hoc view
Step 2. Right click on the Column you wish to sort by.
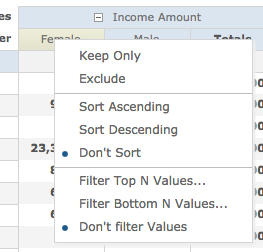
Select Sort Ascending or Sort Descending as required.
To remove a sort, select Don’t Sort.
When a field is sorted, an arrow will appear next to the field label.
Tip: If the sort does not appear to make a difference, you may need to expand a group.

The sorting may be occurring within the group members, not the higher level groups.
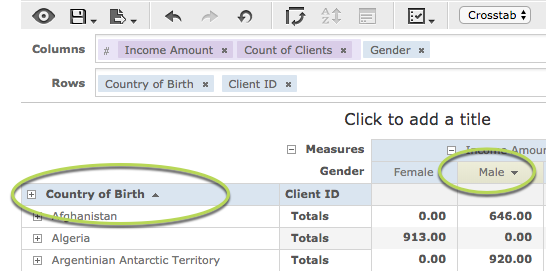
Crosstabs have summary rows and columns by default.
Row Summaries are simple counts, but Column summaries can be various calculations.
Step 3. To remove a Row summary, right click on the row header and select Delete Row Summary
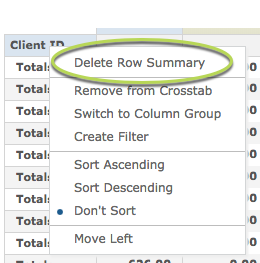
The Row summaries will be removed.
Tip: Row summaries may still appear if a group is collapsed.
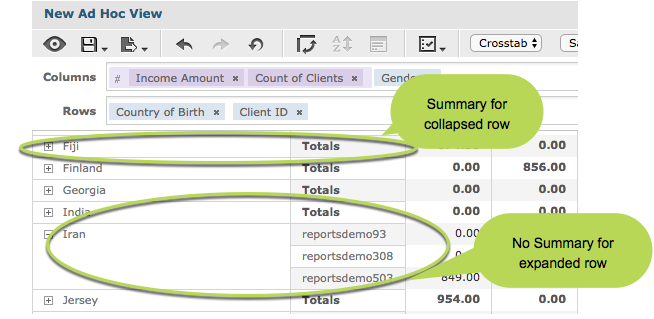
Step 4. Right Click on a top level Column header
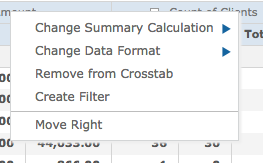
Step 5. Click Change Summary Calculation
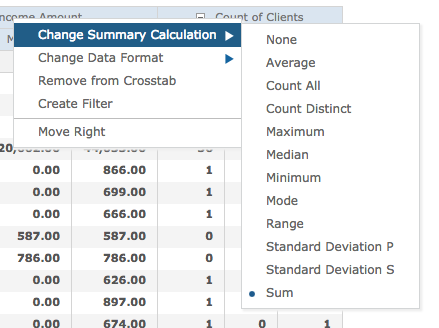
The current calculation is listed with an indicator (blue dot) next to it.
Step 6. Change the calculation to another option e.g. average
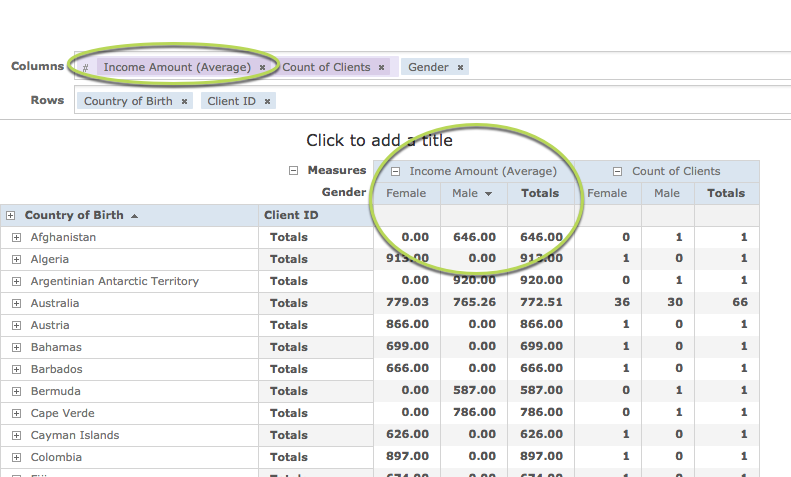
The column header label now includes (average) and the totals column is showing the average figure for each group rather than the sum.
Further Information
For more information on Crosstabs, refer to the Crosstab Ad Hoc Views article.
For further information on Ad Hoc Views, refer to the following articles:
- Ad Hoc View – Table
- Table Ad Hoc View – Details and Totals
- Which Ad Hoc View Should I Use?
- Ad Hoc Views
- Ad Hoc View – Crosstab
- Ad Hoc Views – Charts
