Instructions
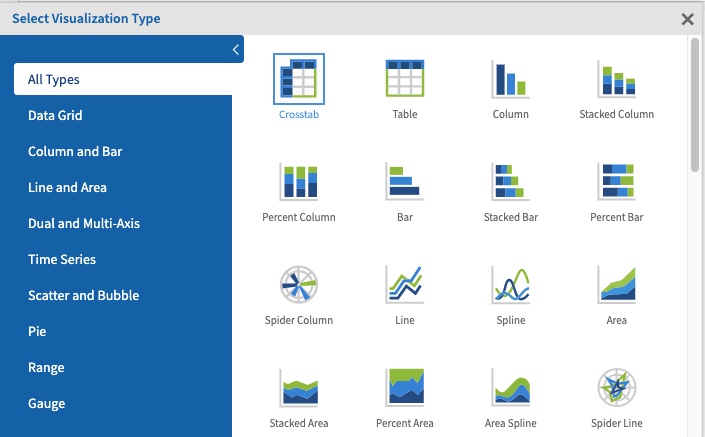
Step 1. Open or create a new ad hoc view (refer to the Creating Ad Hoc Views article for further information) Step 2. Click on the Select Visualisation Type icon in the top menu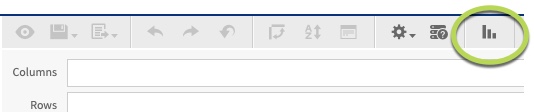
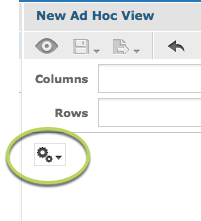
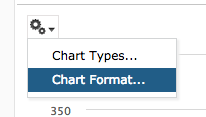
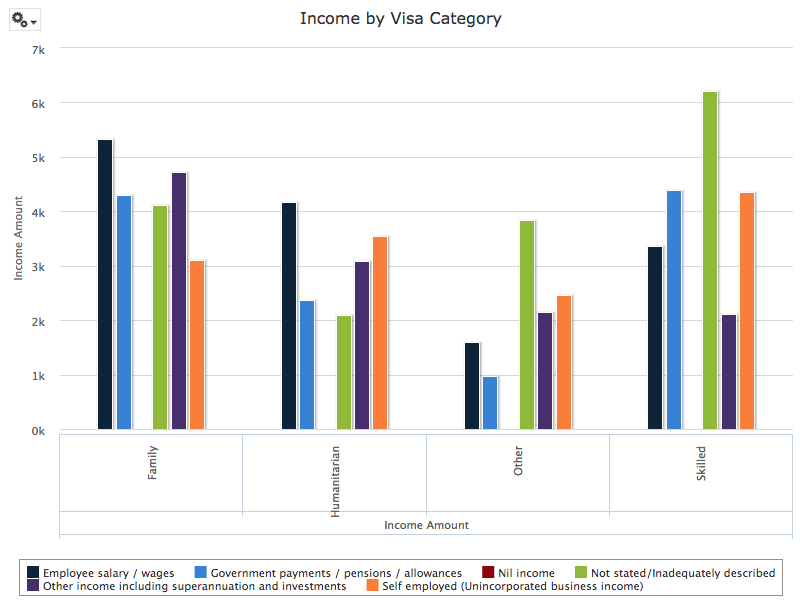 Step 6. To change the chart format, click the options dropdown.
 Step 7. Select Chart Format
 The Axis tab is displayed
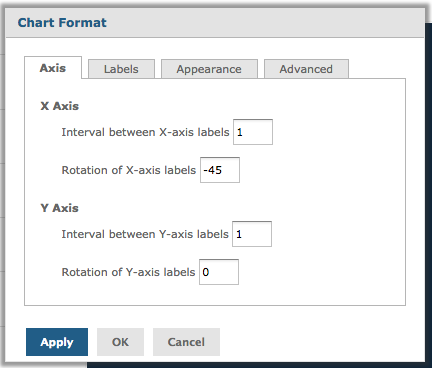 For information on formatting using the Axis tab, refer to the Ad Hoc View – Chart Format – Axis article.
Step 8. Click on the Labels tab
For information on formatting using the Axis tab, refer to the Ad Hoc View – Chart Format – Axis article.
Step 8. Click on the Labels tab
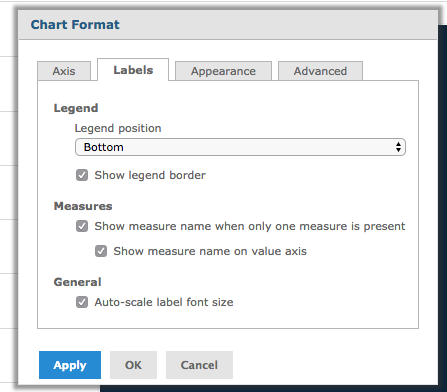 The labels tab allows you to change the look of your chart by configuring the labels.
Update the entry in one of the fields (see below).
Click Apply for the changes to appear on your chart.
Click OK to save the changes and exit.
Legend Options:
The labels tab allows you to change the look of your chart by configuring the labels.
Update the entry in one of the fields (see below).
Click Apply for the changes to appear on your chart.
Click OK to save the changes and exit.
Legend Options:
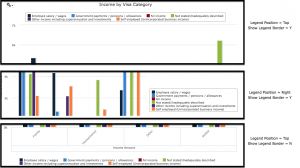
- Legend Position
- Select a Position for the legend to appear, bottom, top, right, left or none
- Show Legend Border
- Check the box to display a border around the legend details
 Measures Options:
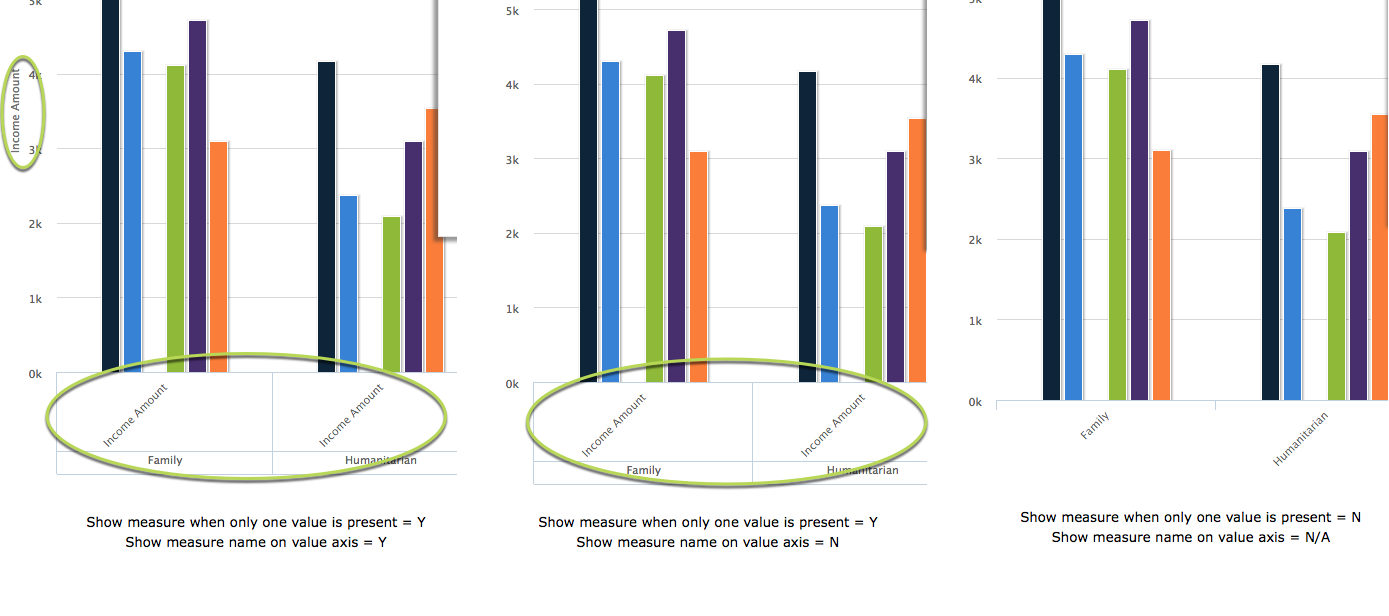
- Show measure name when only one measure is present
- When only one measure is included in your chart, choose whether the display the name of the measure (e.g. income amount)
- Show measure name on value axis
- Choose whether to display the measure name on the value axis
 General Options:
- Auto-scale label font size
- Choose whether to automatically scale the font size