Charts are useful tools for graphically displaying information.
Sometimes, you may wish to change the format of your charts, beyond the basic options.
There are many options available within the Chart Format tool.
Instructions
Step 1. Open or create a new ad hoc view (refer to the Creating Ad Hoc Views article for further information)
Step 2. Click on the Select Visualisation Type icon in the top menu
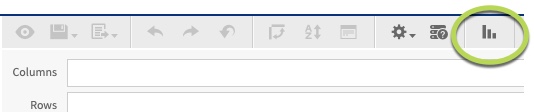
The Select Visualisation Type window is displayed
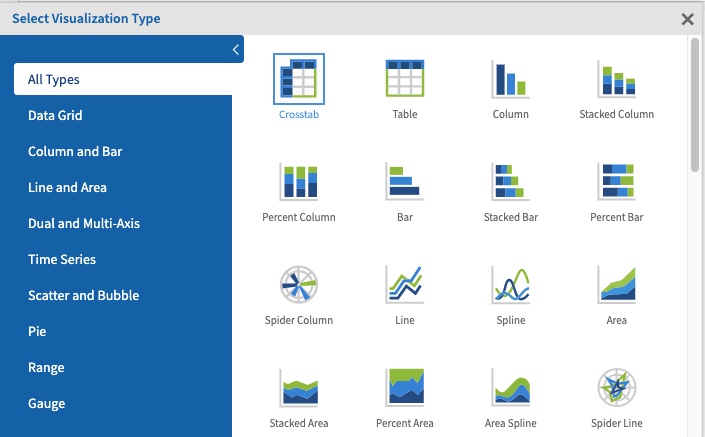
Step 3. Select the required chart type from the list.
You can select a category on the left to narrow down the list.
Step 4. Select the required chart
Step 5. Add the required fields and measures to your chart.
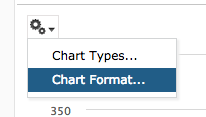
Step 6. To change the chart format, click the options dropdown again.
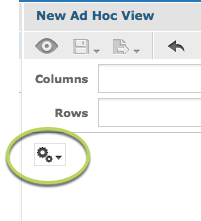
Step 7. Select Chart Format
The Axis tab is displayed
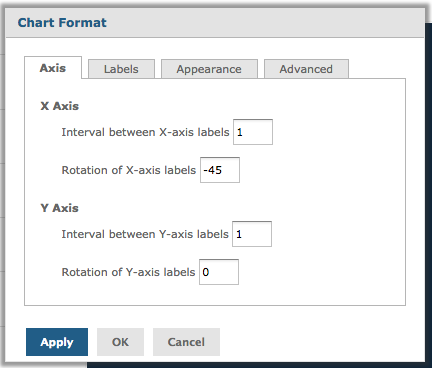
The axis settings allow you to configure how the labels on the horizontal (X) and vertical (Y) axes are displayed.
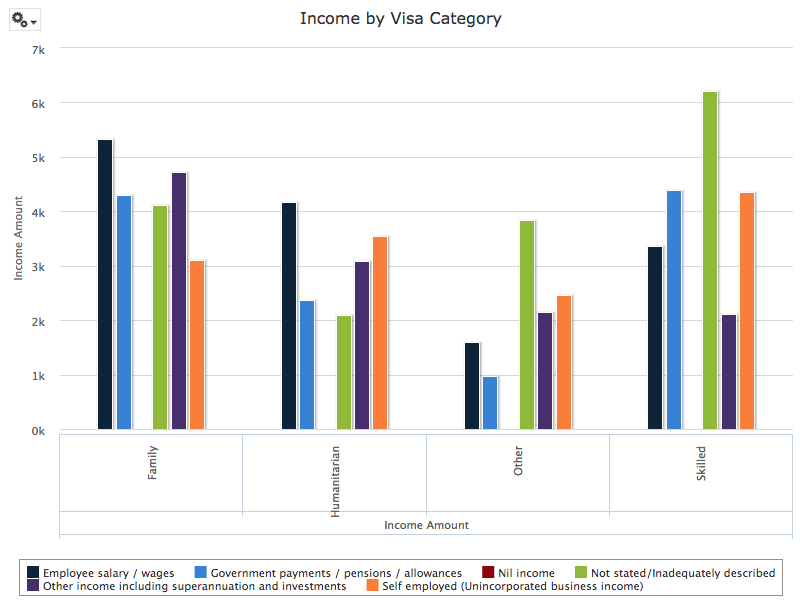
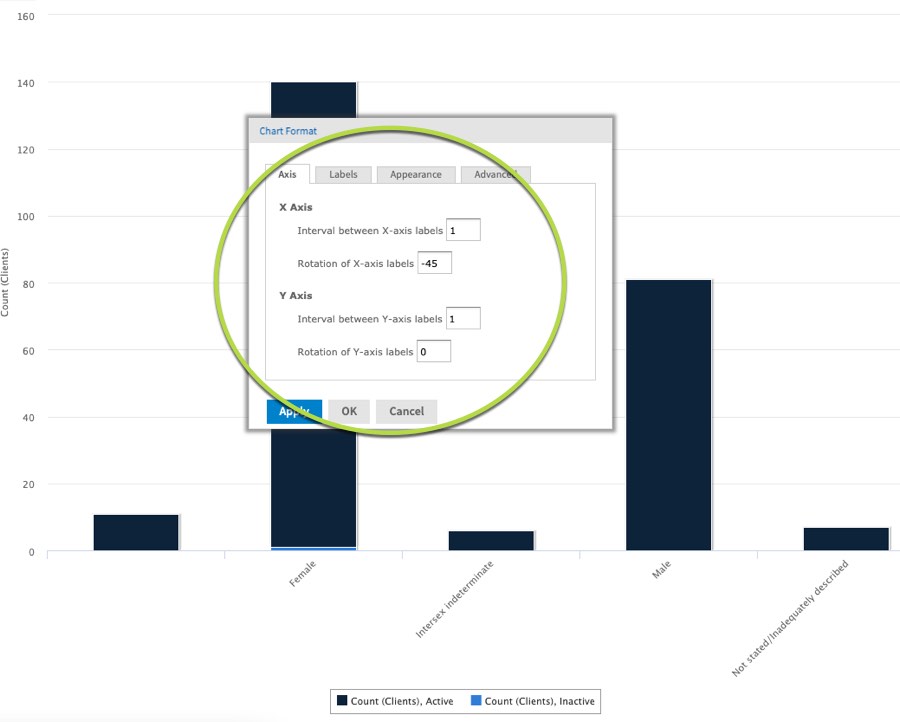
The default format will result in a chart looking like this:
The changeable options are:
- Interval between X-axis labels
- this setting allows you to set the interval between labels on the horizontal (X) axis. You should only amend this setting if the horizontal axis is numeric.
- The example above shows the interval = 1. This displays a label for every column.
- Rotation of X-axis labels
- This setting allows you to change the rotation of the labels on the horizontal (X) axis, useful when the options are longer words.
- The default example has the X-axis labels rotated to -45.
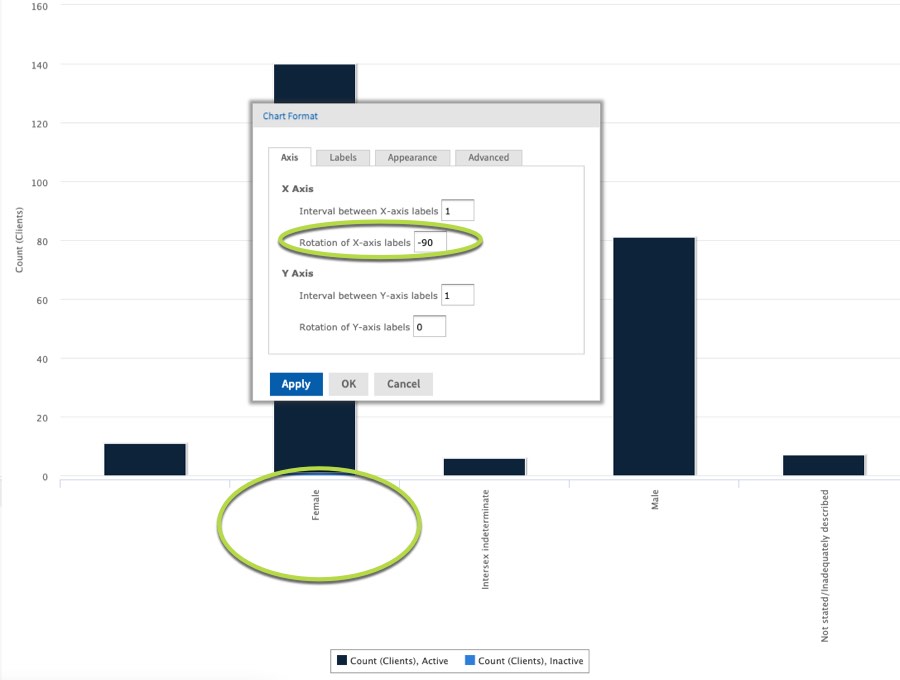
- The example below has the X-axis labels rotated to -90.
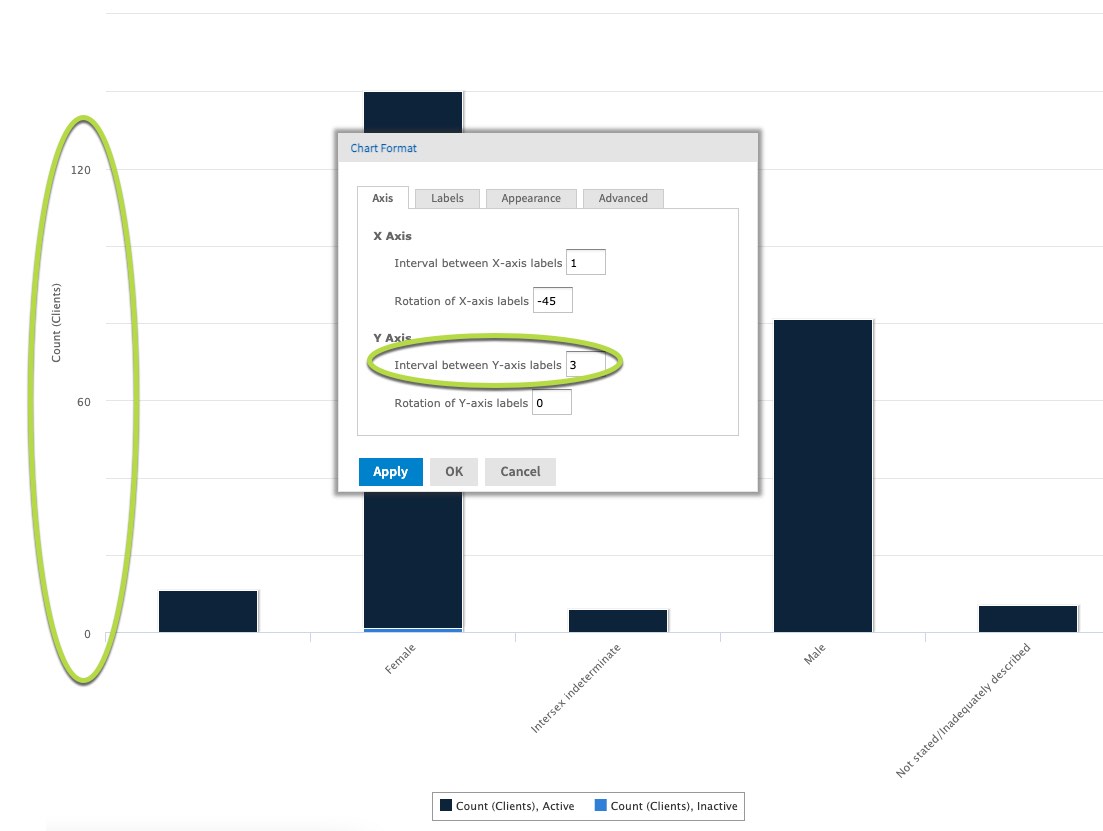
- Interval between Y-axis labels
- this setting allows you to set how many labels are displayed on the vertical (Y) axis. You should only amend this setting if the vertical axis is numeric.
- the default example shows the interval = 1. This displays a label for every row.
- the example below shows the interval = 3. This displays a label for every third row.
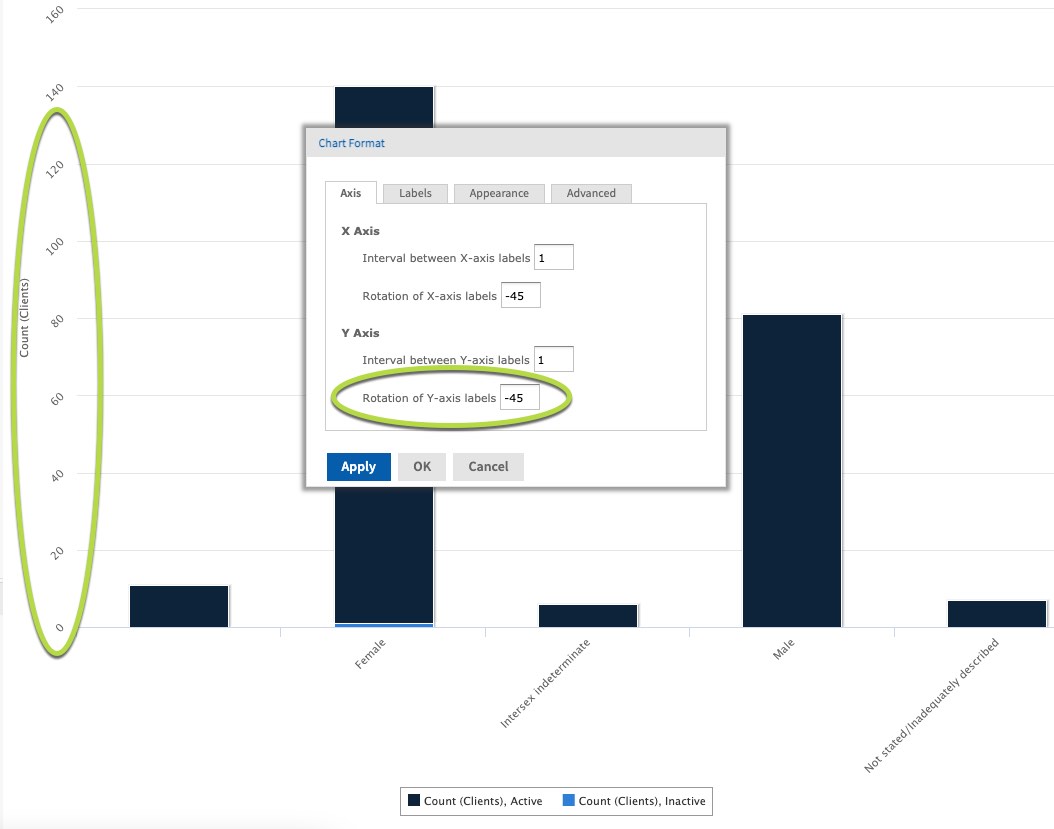
- Rotation of Y-axis labels
- This setting allows you to change the rotation of the labels on the vertical (Y) axis, useful when the options are longer words.
- The default example shows the rotation set to 0.
- The example below shows the rotation set to -45.
Further information
For more information on working with chart formats, refer to the following articles: