Charts are useful tools for graphically displaying information.
Sometimes, you may wish to change the format of your charts, beyond the basic options.
There are many options available within the Chart Format tool.
Instructions
Step 1. Open or create a new ad hoc view (refer to the Creating Ad Hoc Views article for further information)
Step 2. Click on the Select Visualisation Type icon in the top menu
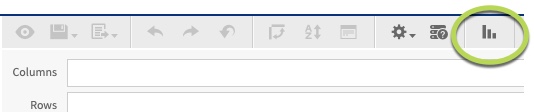
The Select Visualisation Type window is displayed
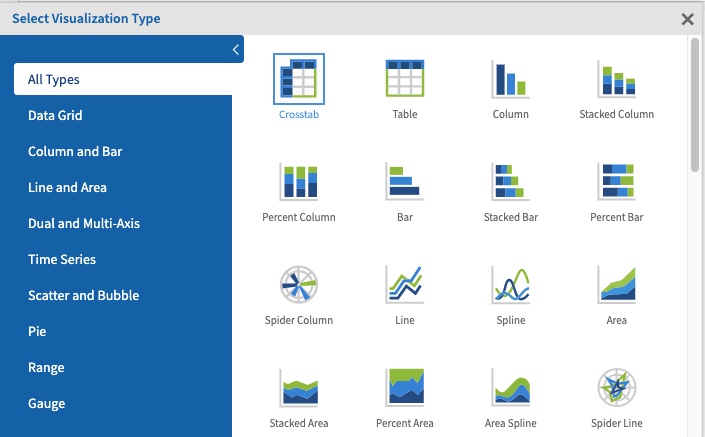
Step 3. Select the required chart type from the list.
You can select a category on the left to narrow down the list.
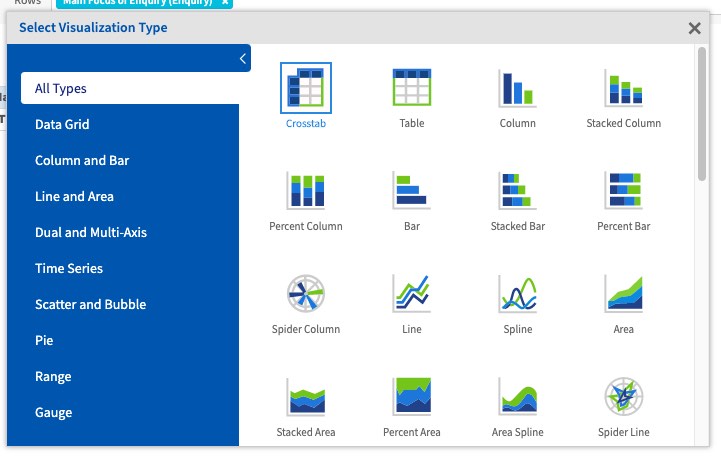
Step 4. Select the required chart
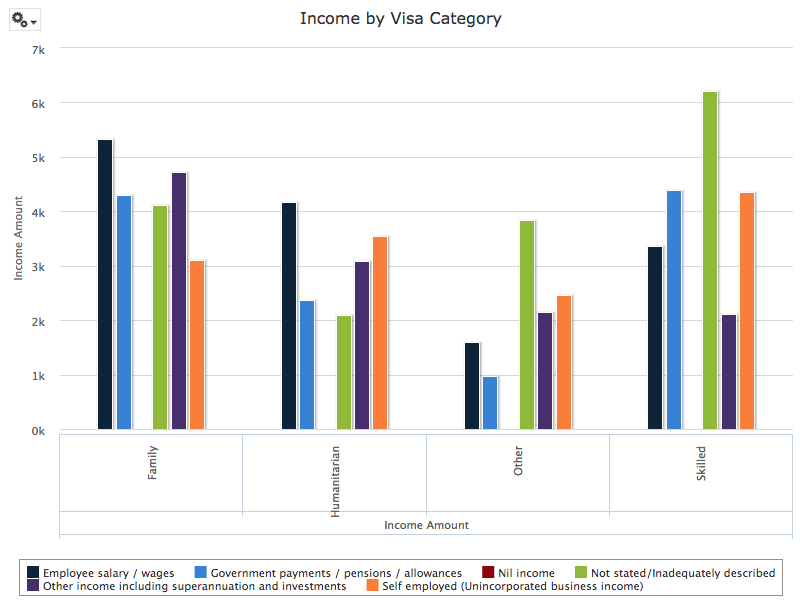
Step 5. Add the required fields and measures to your chart.
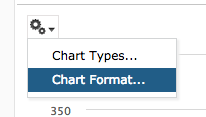
Step 6. To change the chart format, click the options dropdown.
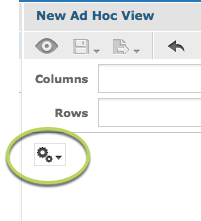
Step 7. Select Chart Format
The Axis tab is displayed
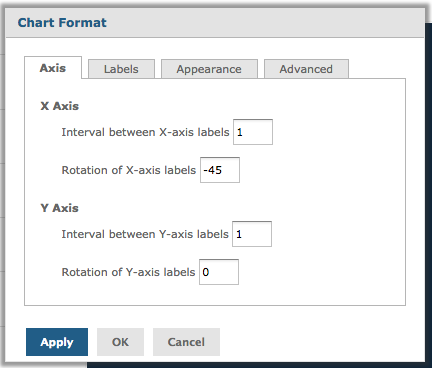
For information on formatting using the Axis tab, refer to the Ad Hoc View – Chart Format – Axis article.
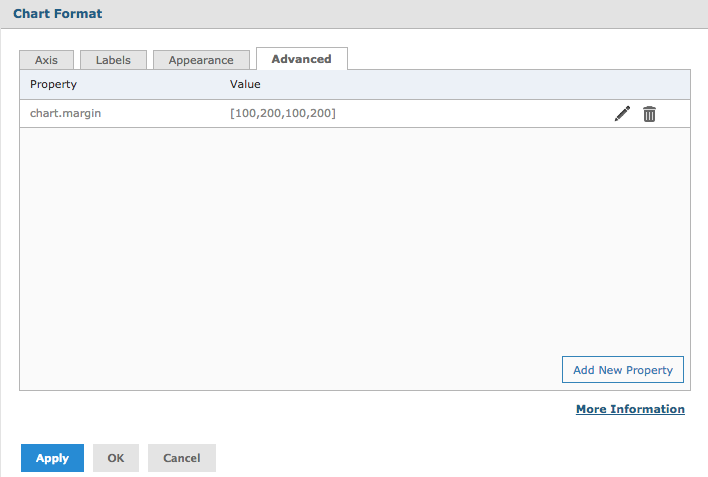
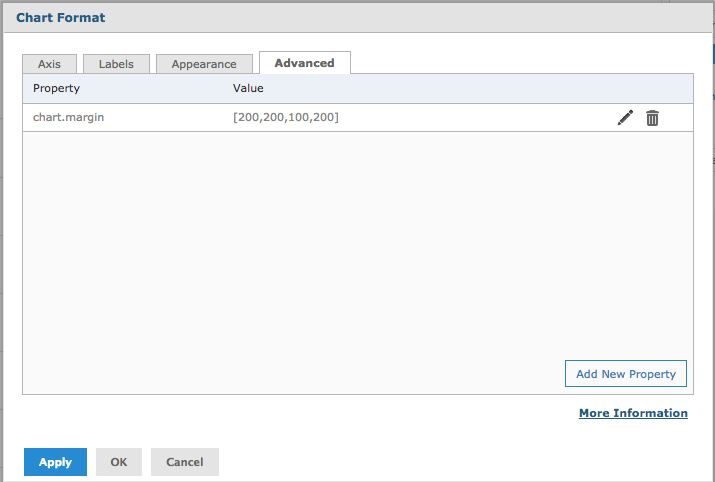
Step 8. Click on the Advanced tab
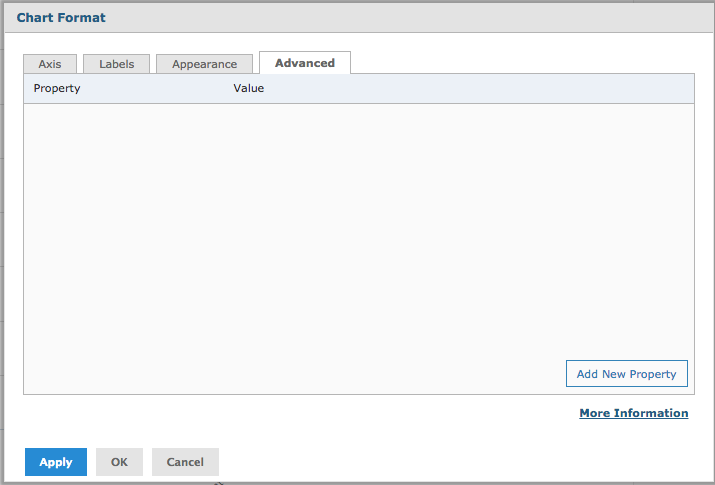
The Advanced tab allows you to add various properties to your charts which will provide much more flexibility in your display.
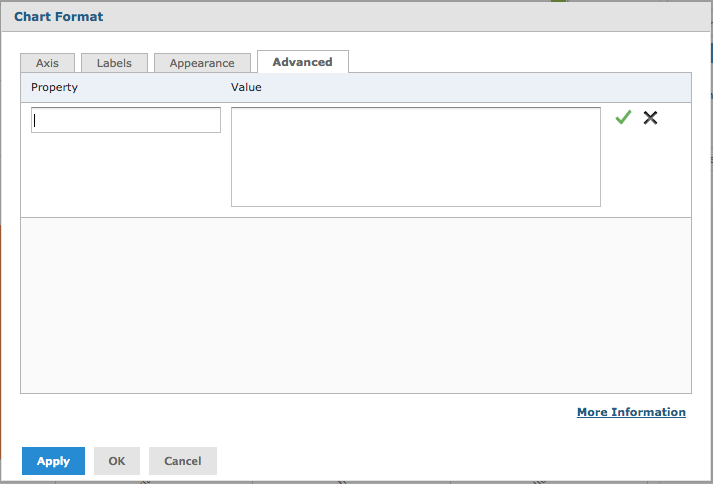
Step 9. To add an advanced property, Click Add New Property
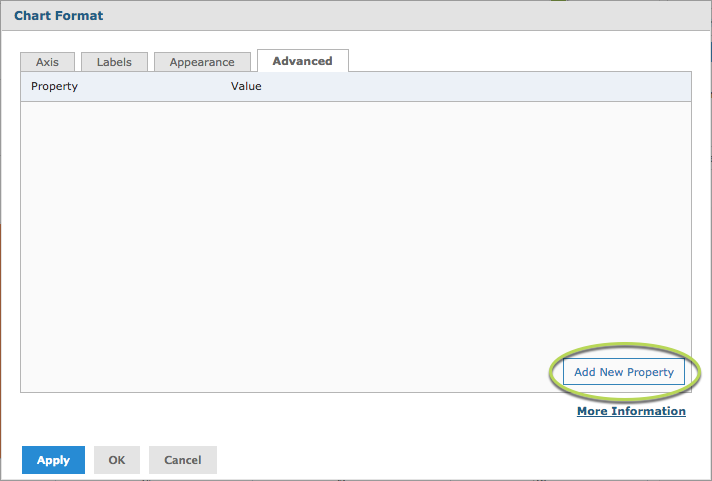
The property fields are displayed
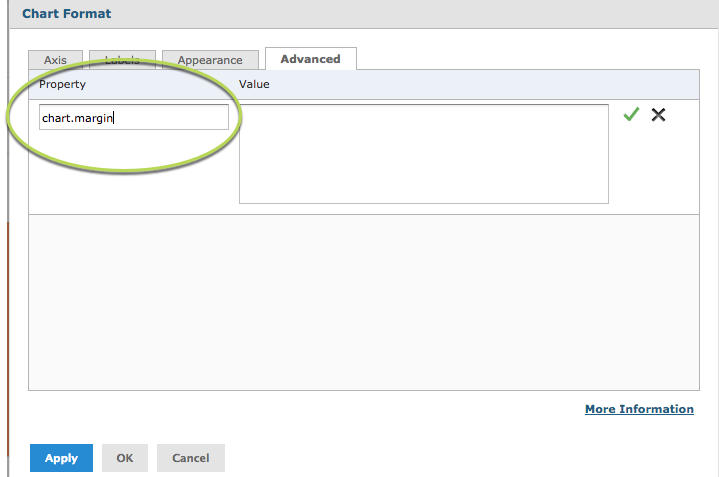
Step 10. Enter the property name in the Property field e.g. chart.margin
Step 11. Enter the property value in the Value field e.g. [100,200,100,200]
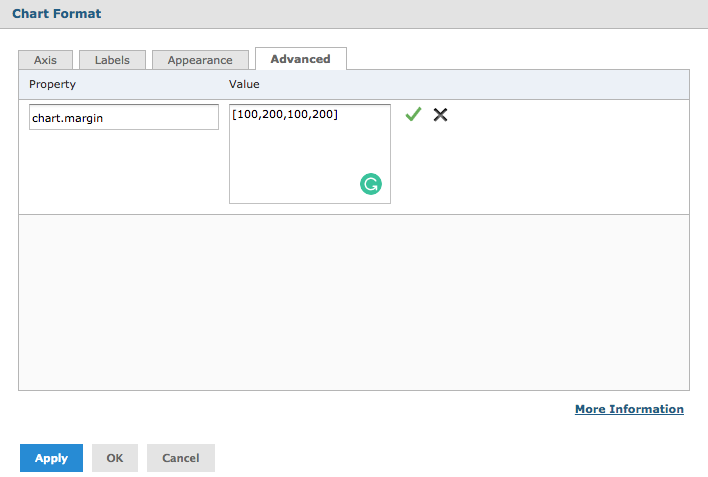
Step 12. Click the green tick to save the property
Step 13. Click apply to see the settings on your chart
Step 14. Click OK to exit the editor.
Some useful examples are below:
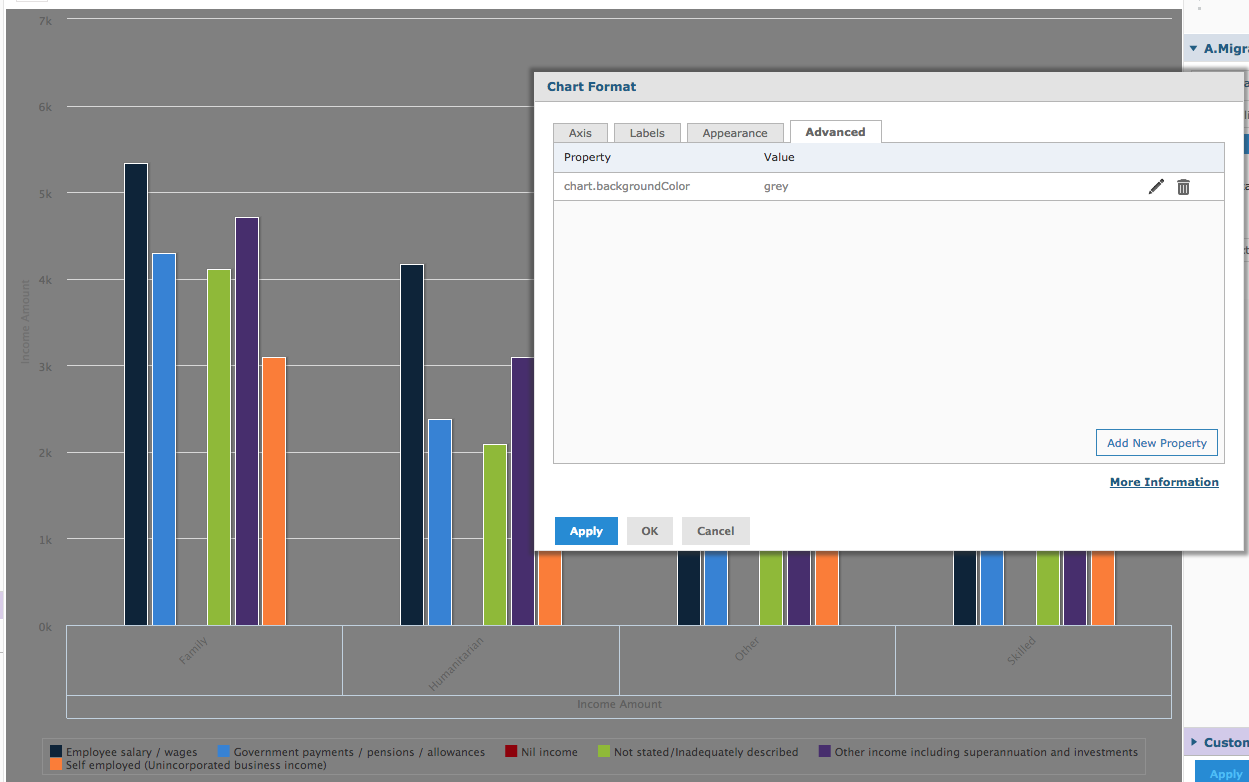
- Chart background Colour
- Set the colour of the background behind your chart
- Property = chart.backgroundColor
- values = supported colour name or hex code
Tip: for a list of supported colors and hex codes,
refer to this link
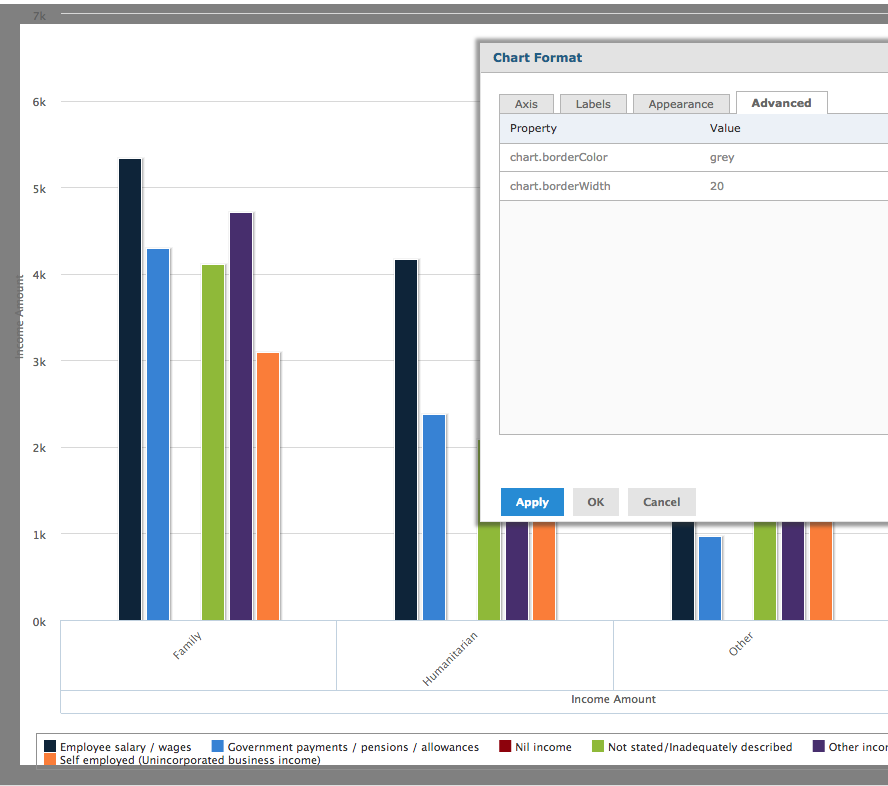
- Chart border Colour
- Set the colour of the border around your chart
- Property = chart.borderColor
- values = supported colour name or hex code
- Chart border Width
- Set the width of the border around your chart
- Property = chart.borderWidth
- value = numeric
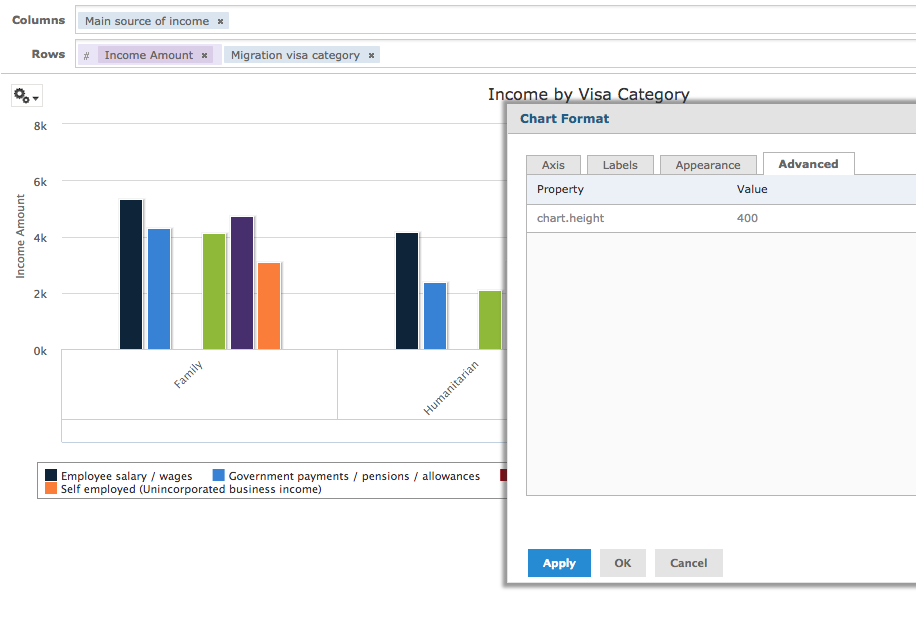
- Chart height
- Set the total height of your chart
- Property = chart.height
- value = numeric
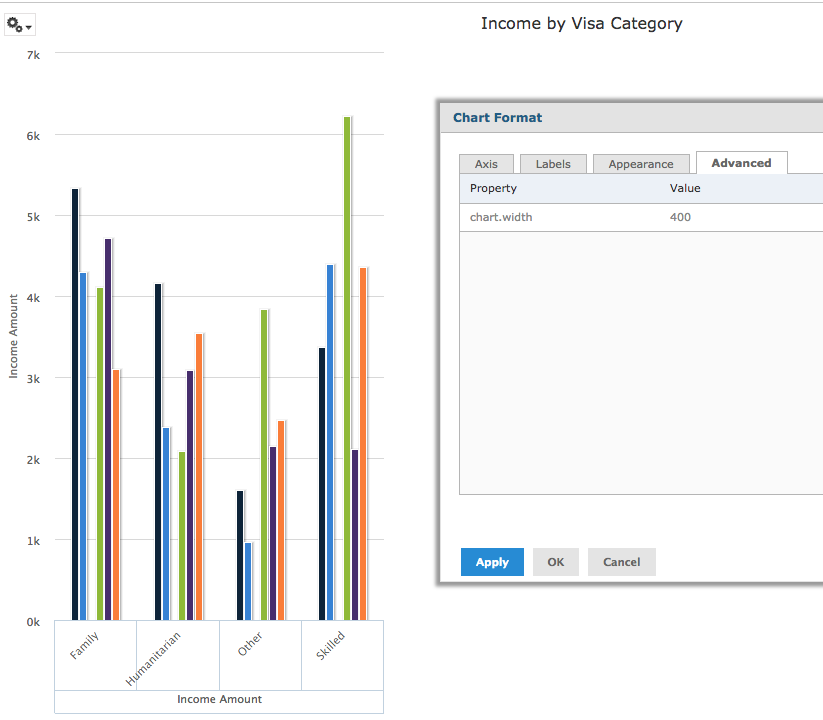
- Chart width
- Set the total width of your chart
- Property = chart.width
- value = numeric
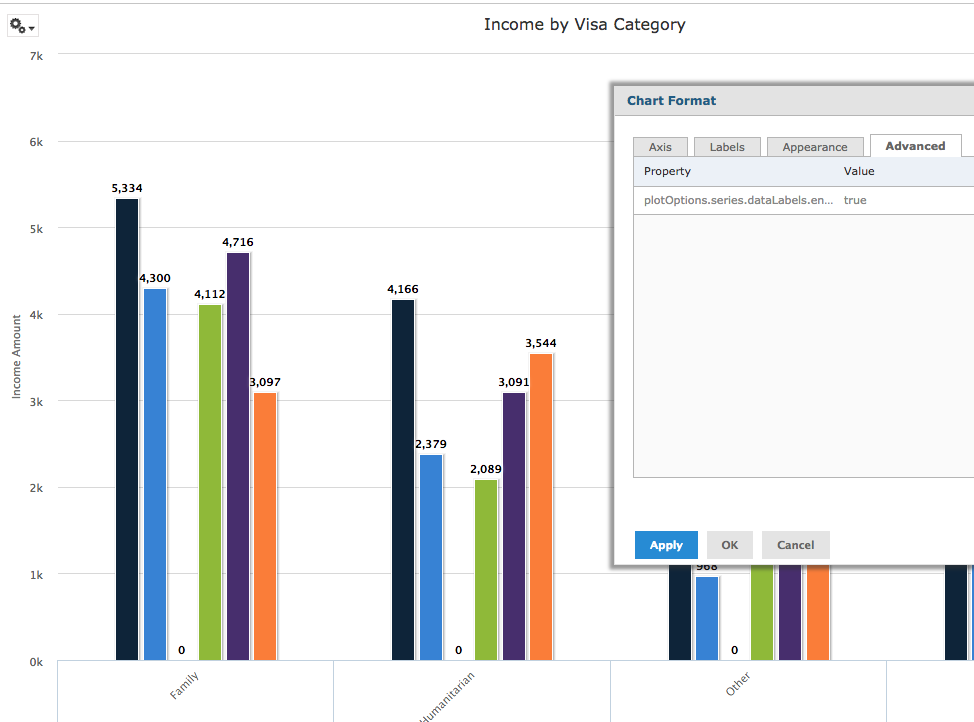
- Data Labels
- Display data values on your chart
- Property = plotOptions.series.dataLabels.enabled
- values = true or false
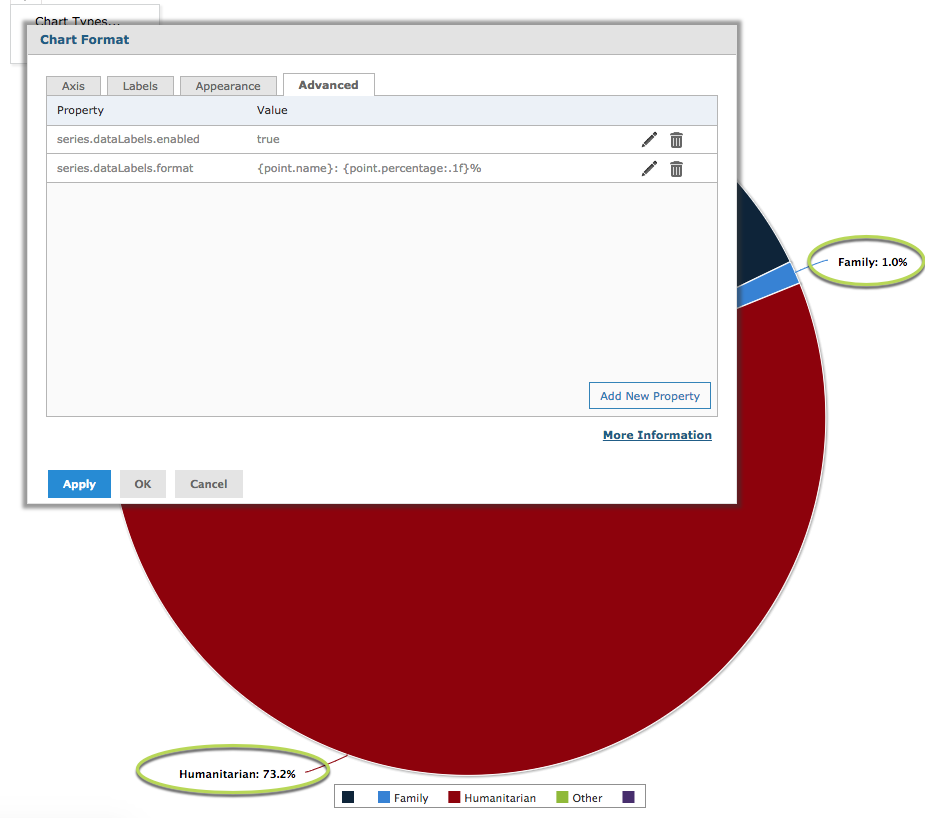
- Data Labels (Pie Chart Percentage)
- Display segment percentages on your pie chart
- Property = series.dataLabels.enabled
- value = true
- Property = series.dataLabels.format
- value = {point.name}: {point.percentage:.1f}%
Step 15. To edit an advanced property, open the Chart Format window (see steps 6-8).
Step 16. Click the edit (pencil) icon next to the property.
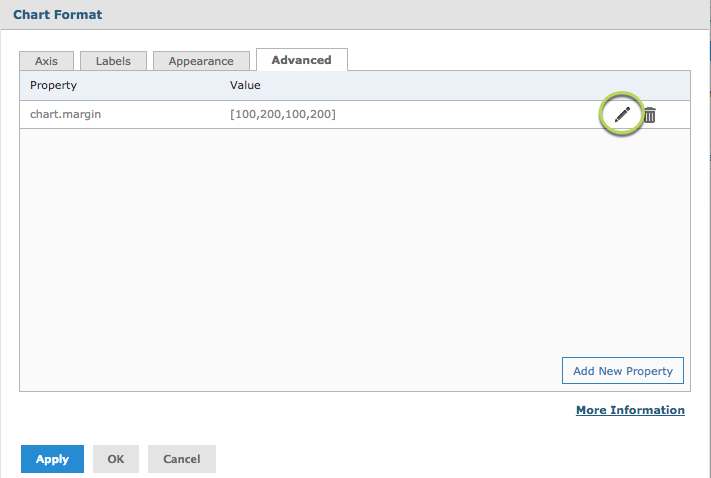
Step 17. Make any required changes, then click the green tick to stop editing.
Step 18. Click Apply for the changes to appear on your chart.
Step 19. Click OK to close the Chart Format window.
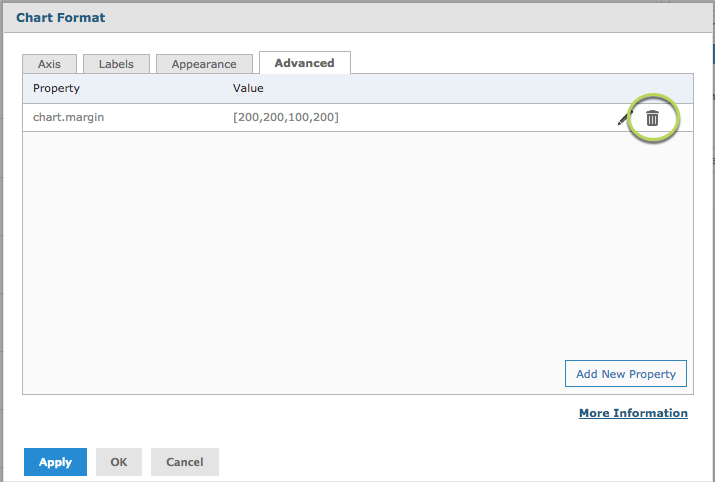
Step 20. To delete an advanced property, open the Chart Format window (see steps 6-8)
Step 21. Click the delete (bin) icon next to the property.
Step 22. Click Yes to confirm the deletion
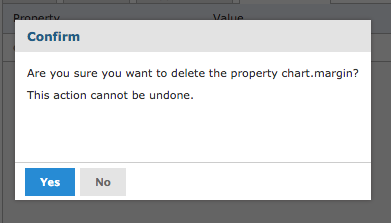
The property is removed from the Advanced tab.
Step 23. Click Apply to remove the formatting from your chart.
Step 24. Click OK to exit the Chart Format window.
For more information on advanced tab formatting, refer to the Jaspersoft wiki, or click the More Information link on the Advanced tab of the Chart Format window.
Further information
For more information on working with chart formats, refer to the following articles: