When displaying information in an Ad Hoc View, you will generally include Fields and Measures.
Measures contain summarised values. They are typically numeric fields that determine how the selected component of a chart appears. i.e. the length of a bar in a bar chart.
Instructions
Step 1. Once your view has been created (link to BI Ad Hoc View article) you may wish to include a measure in your chart or crosstab view.
Step 2. Click and drag the required measure to the Rows or Columns area as required.
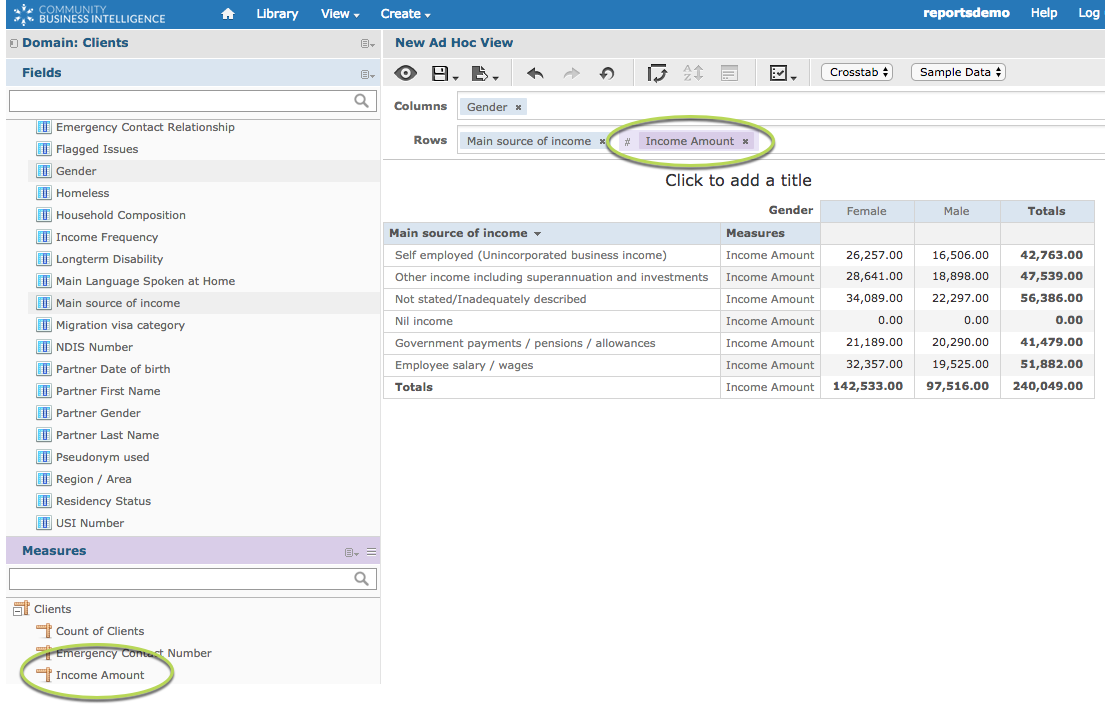
Step 3. Right Click on the measure name in the Columns/Rows area
The measures menu is displayed
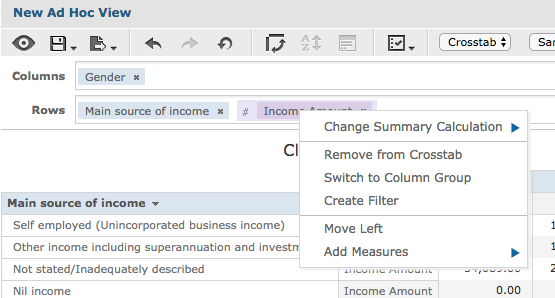
Step 4. Select Change Summary Calculation
The Summary Calculation options are displayed
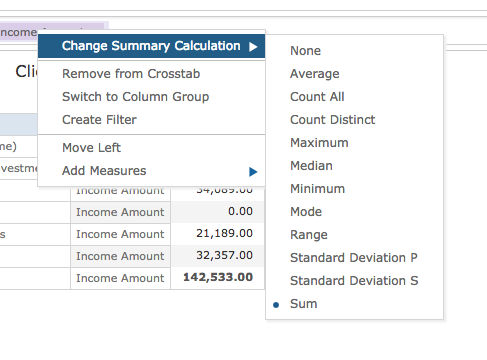
Currently the Summary Calculation has defaulted to Sum (as indicated by the blue dot next to Sum), but you may wish to use a different calculation.
Step 5. Select Average from the Summary Calculation list.
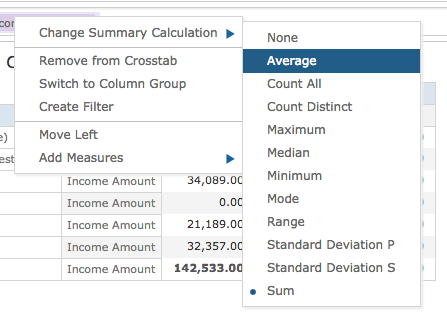
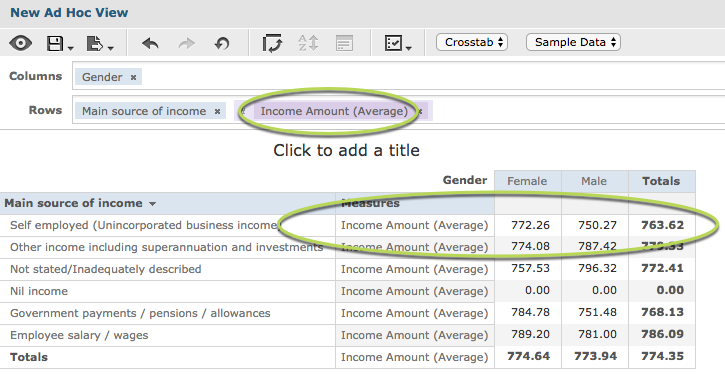
The chart now displays the average amount, rather than the total for the selected measure.
The measure title is also updated to show that it is an average rather than a sum.
You can select from a number of different calculations depending on what information you wish to display in your view.
When completed, save your view as required.
Further information
For more information, refer to the following articles:
