Ad Hoc Views allow you to visualise and analyse the data you capture for your organisation.
Ad Hoc Views can be viewed in the Community BI system or in reports and dashboard.
Calculated Fields and Measures allow you to calculate additional information from your captured data.
When you have data with a date field, you may wish to group records by Financial or Calendar years.
Instructions
Step 1. Open or create a new Ad Hoc View (refer to Creating Ad Hoc Views for further information)
Step 2. Refer to Calculated Fields and Measures for detailed instructions to create your measure
Step 3. Refer to the examples below for Measure names and formulas
Step 4. Add the calculated field to your Ad Hoc View
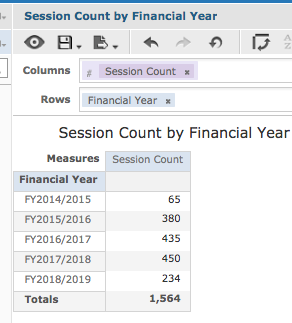
To show the measures grouped by Financial year:
Measure Name = Financial Year
Formula = CaseWhen(MonthNumber("Date") <= 6, Concatenate('FY', Year("Date") - 1, '/', Year("Date")),
Concatenate('FY', Year("Date"), '/', Year("Date") + 1))
Note - where the example above uses "Date" you will need to substitute
the appropriate date field from your database.
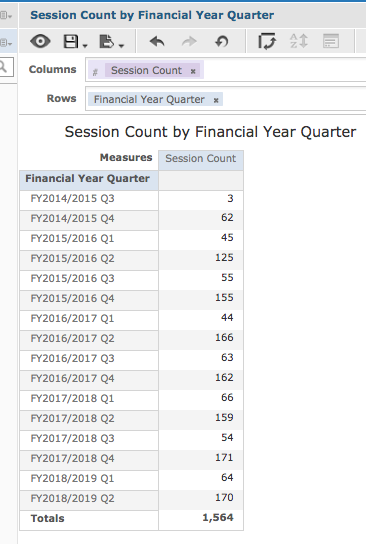
To show the measures grouped by Financial years in quarters:
Measure Name = Financial Year Quarter
Formula =CaseWhen(MonthNumber("Date") <= 3, Concatenate('FY', Year("Date") - 1, '/', Year("Date"),
' Q3'), CaseWhen(MonthNumber("Date") <= 6, Concatenate('FY', Year("Date") - 1, '/', Year("Date"),
' Q4'), CaseWhen(MonthNumber("Date") <= 9, Concatenate('FY', Year("Date"), '/', Year("Date") + 1, ' Q1'),
Concatenate('FY', Year("Date"), '/', Year("Date") + 1, ' Q2'))))
Note - where the example above uses "Date" you will need to substitute
the appropriate date field from your database.
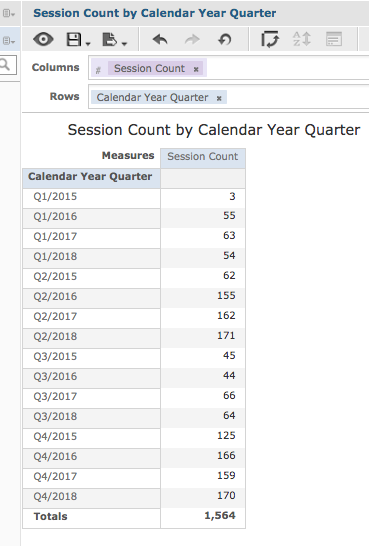
To show the measures grouped by Calendar years in quarters:
Measure Name = Calendar Year Quarter
Formula =CaseWhen(MonthNumber("Date") <= 3, Concatenate('Q1/', Year("Date")),
CaseWhen(MonthNumber("Date") <= 6, Concatenate('Q2/', Year("Date")), CaseWhen(MonthNumber("Date") <= 9,
Concatenate('Q3/', Year("Date")), Concatenate('Q4/', Year("Date")))))
Note - where the example above uses "Date" you will need to substitute
the appropriate date field from your database.
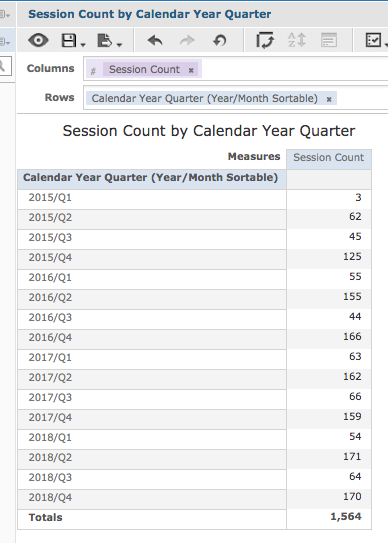
To show the measures grouped by Calendar years in quarters, sorted by the year, then quarter:
Measure Name = Calendar Year Quarter (Sortable year first)
Formula =CaseWhen(MonthNumber("Date") <= 3, Concatenate(Year("Date"), '/Q1'),
CaseWhen(MonthNumber("Date") <= 6, Concatenate(Year("Date"), '/Q2'), CaseWhen(MonthNumber("Date") <= 9,
Concatenate(Year("Date"), '/Q3'), Concatenate(Year("Date"), '/Q4'))))
Note - where the example above uses "Date" you will need to substitute
the appropriate date field from your database.
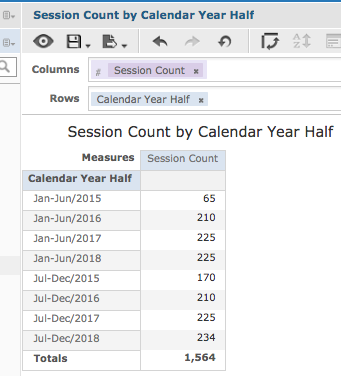
To show the measures grouped by Calendar years in halves:
Measure Name = Calendar Year Half
Formula =CaseWhen(MonthNumber("Date") <= 6, Concatenate('Jan-Jun/', Year("Date")),
Concatenate('Jul-Dec/', Year("Date")))
Note - where the example above uses "Date" you will need to substitute
the appropriate date field from your database.
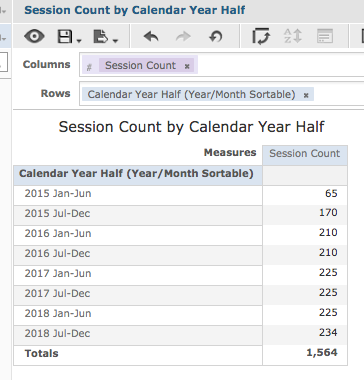
To show the measures grouped by Calendar years in halves, sorted by the year, then half:
Measure Name = Calendar Year Half (Sortable year first)
Formula = CaseWhen(MonthNumber("Date") <= 6, Concatenate(Year("Date"), ' Jan-Jun'),
Concatenate(Year("Date"), ' Jul-Dec'))
Note - where the example above uses "Date" you will need to substitute
the appropriate date field from your database.
Further Information
For further information on Ad Hoc Views, refer to the following articles:
