Instructions
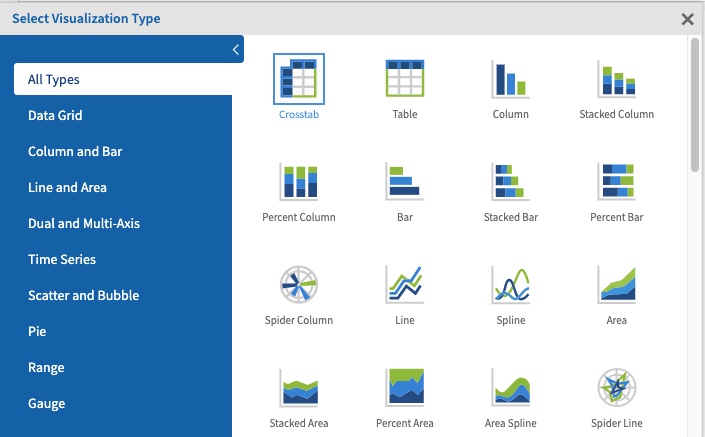
Step 1. Open or create a new ad hoc view (refer to Creating Ad Hoc Views article for further information) Step 2. Click on the Select Visualisation Type icon in the top menu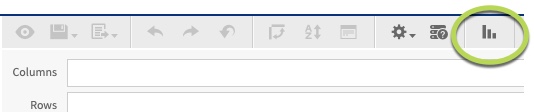
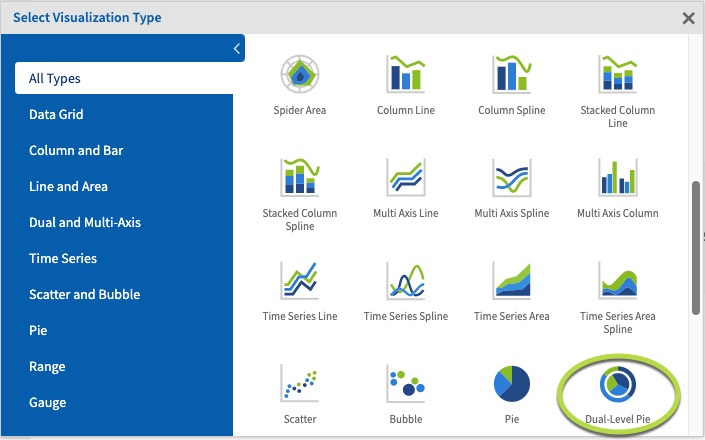
Tip: Dual-Level Pie Charts must have at least one measure (count of clients) and one field (Primary Address City).

Only one field can be placed in the Rows area if the box contains a measure.

Two fields can be placed in the rows area if the box contains no measures.

Multiple measures can be added to rows, but only one to columns.
Step 4. Click and drag a measure from the measures area on the left-hand side pane to a column.
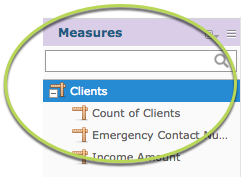 e.g. Count of Clients
Step 5. Add a field from the Fields area on the left-hand side to a row.
e.g. Count of Clients
Step 5. Add a field from the Fields area on the left-hand side to a row.
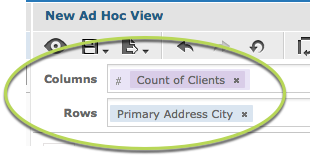 e.g. Primary Address City
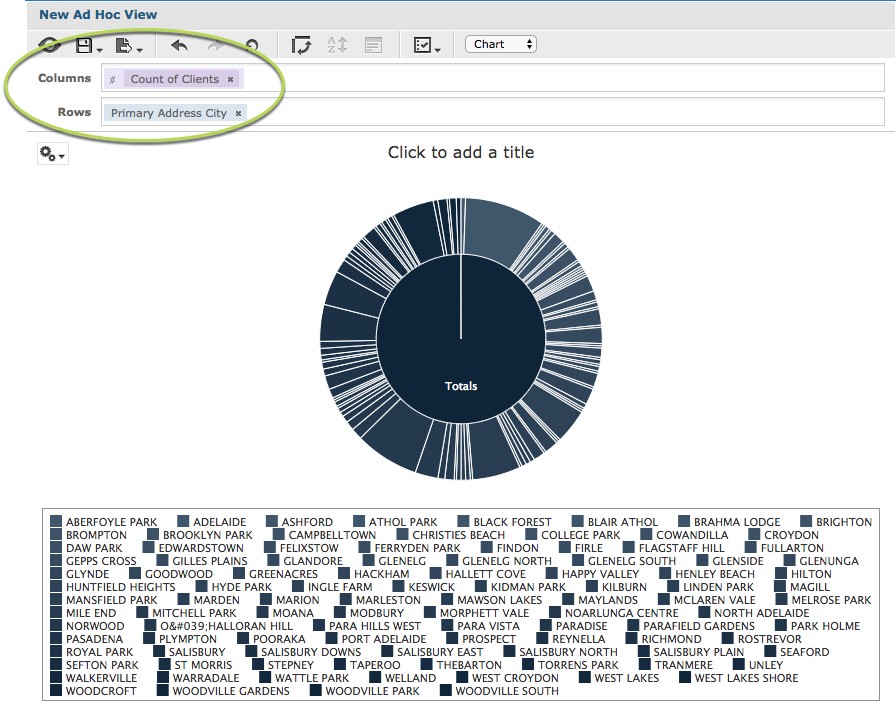
The chart displays the total for the measure in the inner circle. The outer circle shows the measure split by the field.
e.g. Primary Address City
The chart displays the total for the measure in the inner circle. The outer circle shows the measure split by the field.
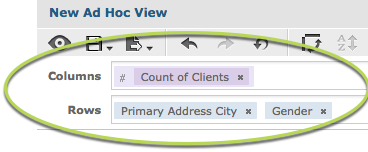
 Step 6. To break up the measure further, add another field to the rows section. E.g. gender
 The inner circle displays Count of Clients for each Primary Address City. The outer circle breaks those areas by gender.
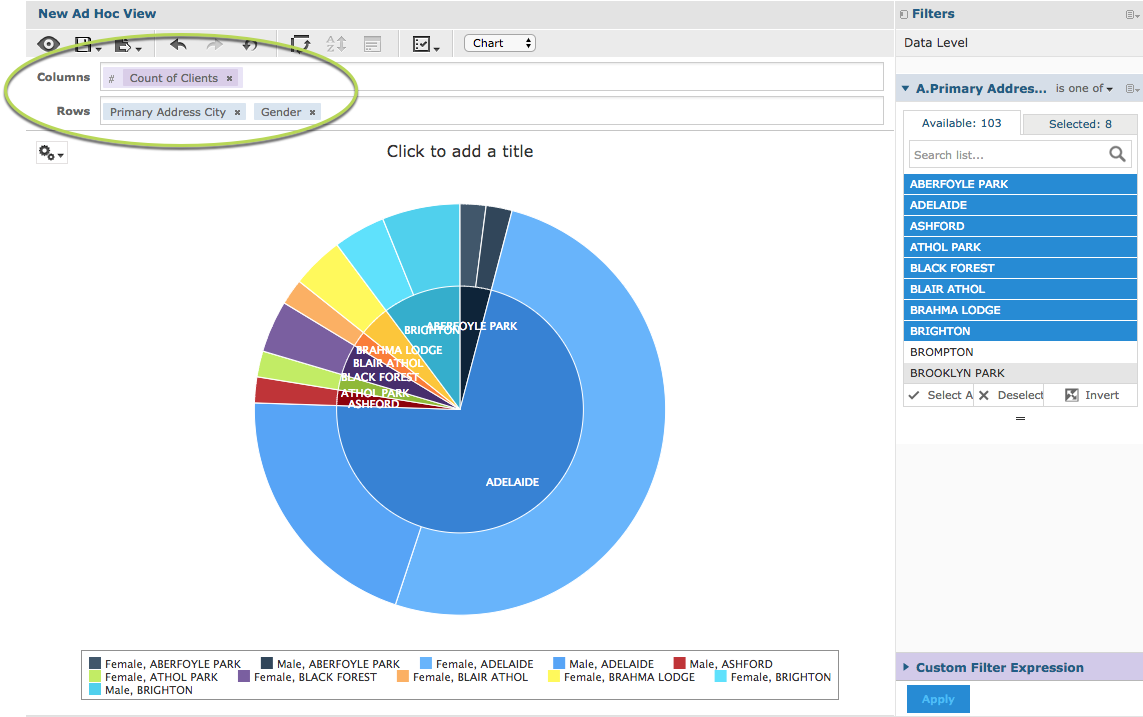 Note – to make the chart clearer, we have added a filter to only show a subset of data. For more information on Filters, refer to the Ad Hoc View – Filters article.