The following video shows an example of a Column Chart Ad Hoc View.
The Chart includes the following information:
- Gender
- Income Amount (Average)
- Household Composition
- Count of Clients
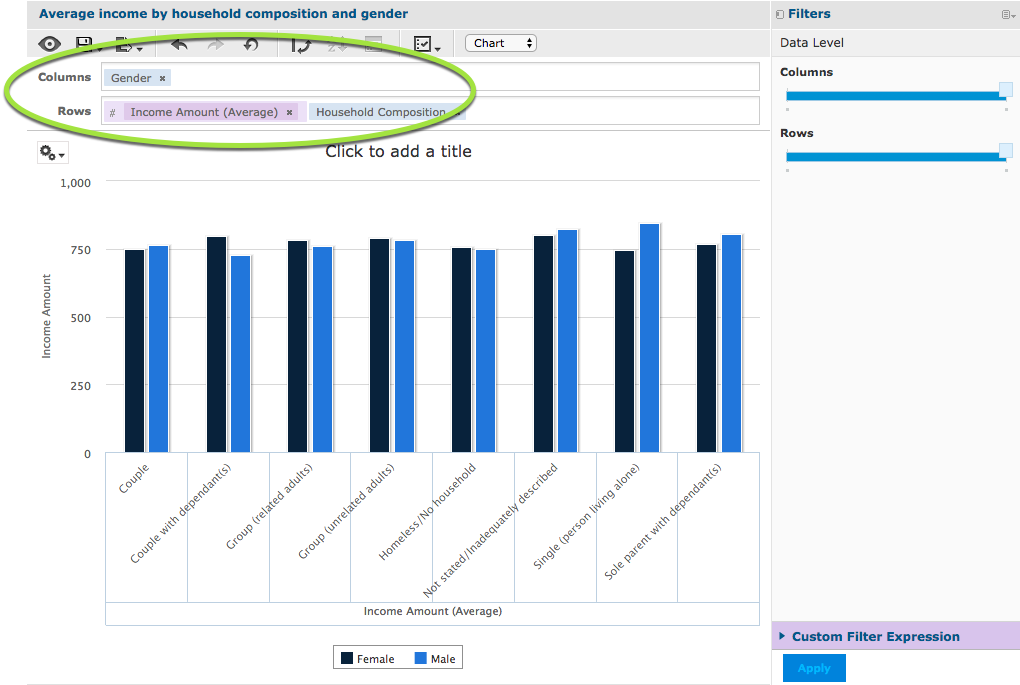
This is a Chart View that allows you to quickly compare average income amounts for males and females in the same household situations.
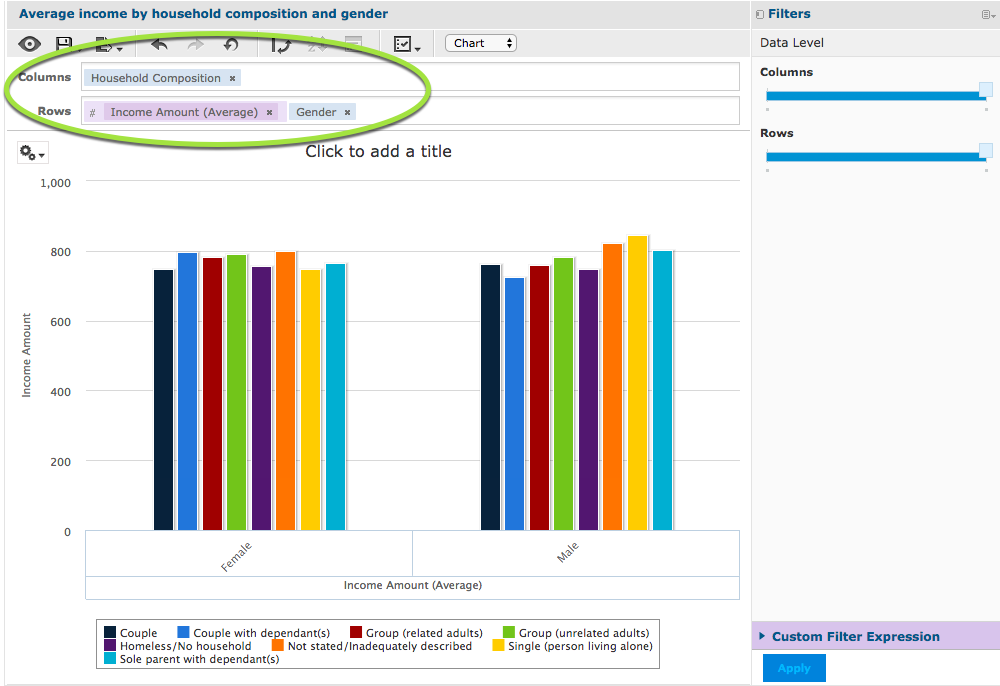
If you were more interested in comparing the differences in income for females across differing households, you can swap the gender field to rows and household composition field to columns.
There are many chart types available to display your information. It is worth trying different types to achieve the best display.
Here is the same data displayed in a Dual Level Pie Chart
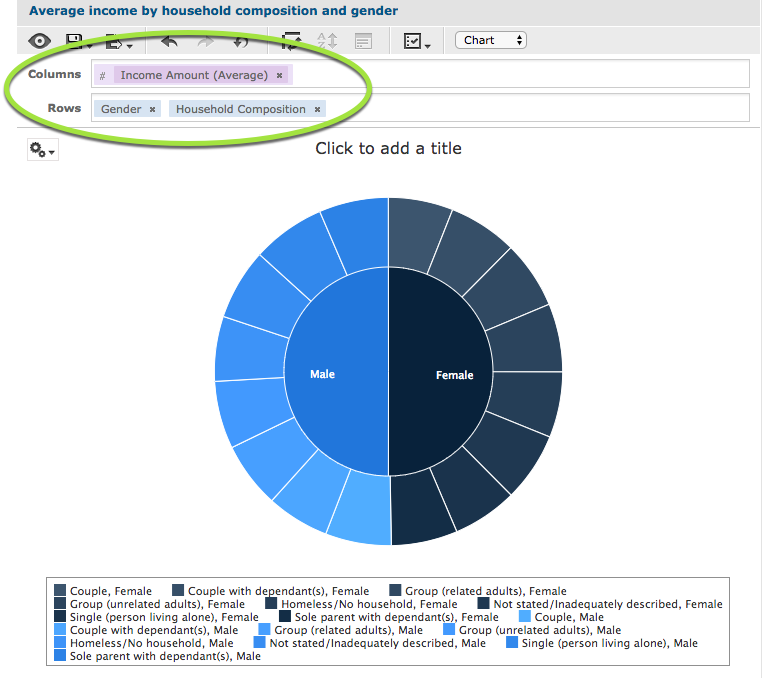
While the data itself remains the same, changing the chart type, order or field location displays the data in very different ways.
Further Information
For information on creating Chart Ad Hoc Views, refer to the following article: