A Dashboard is comprised of dashlets – individual items that are added to the dashboard. These may include Ad-Hoc views (chart, table or crosstab), Reports, Text, Webpages or images.
Instructions
Step 1. Open or Create a new Dashboard (refer to the Creating Dashboards articles for further information.
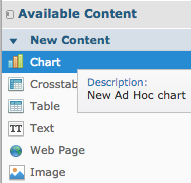
Step 2. Click and drag a new Chart content item to the dashboard
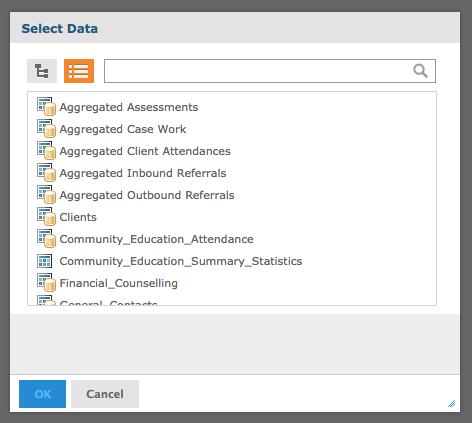
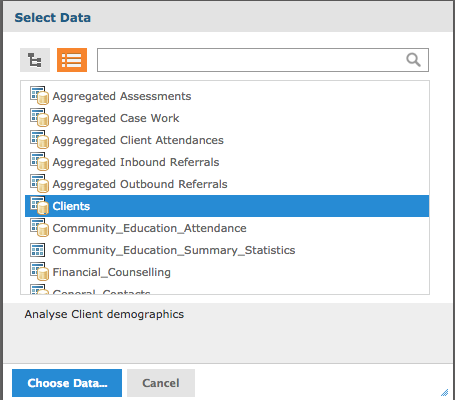
Step 3. Select the required data for your Chart
Step 4. Click Choose Data
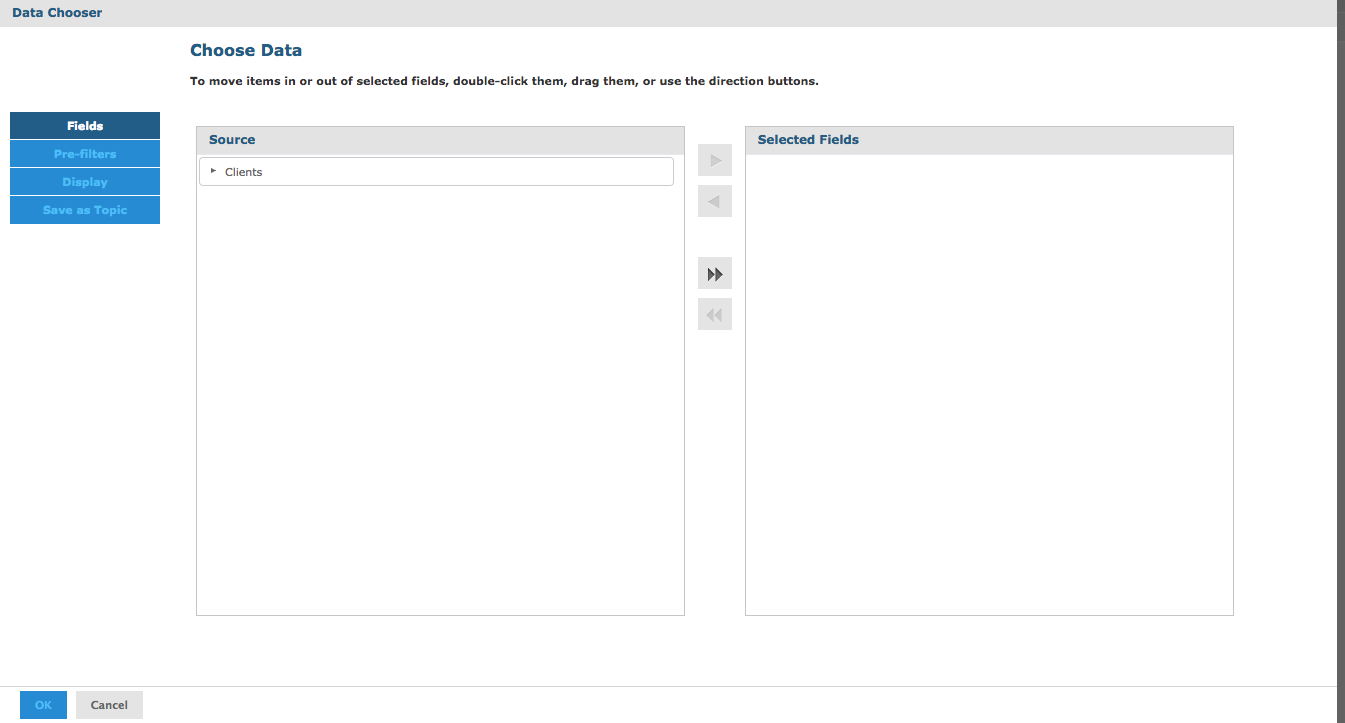
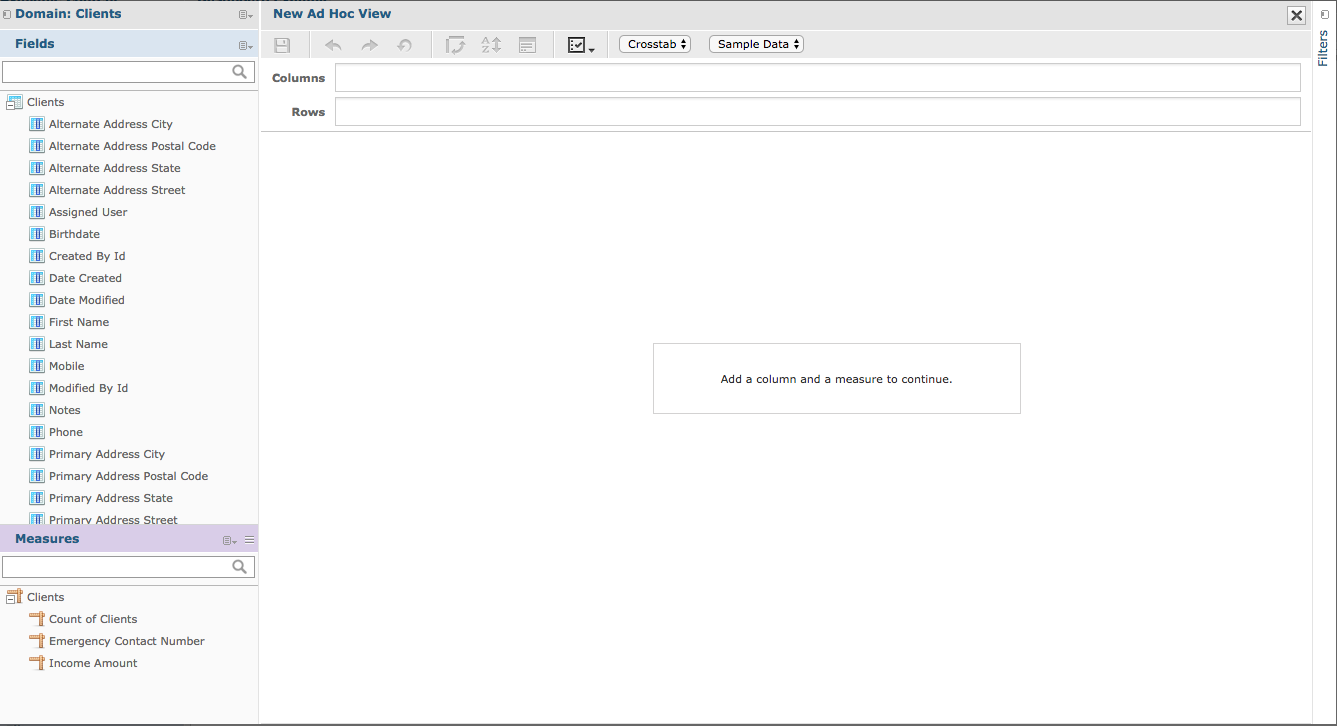
Step 5. Use the Data Chooser to select the required fields for your table
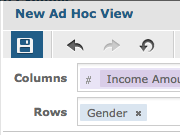
Step 6. Use the New Ad Hoc View window to configure your Crosstab
Refer to the Which Chart should I use? article for more information on selecting your Chart.
Refer to the article for your selected chart for more information.
Step 7. Once complete, click the Save button
Step 8. Enter a dashlet name
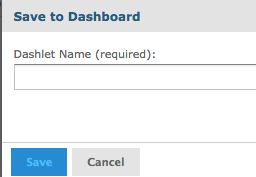
Step 9. Click Save
The dashlet Chart appears in the dashboard.
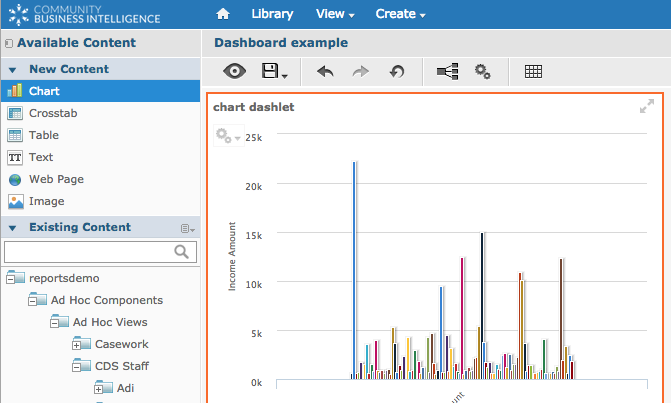
Tip: You may wish to resize the dashlet after you save it for the best display
Further Information
For information on adding a new Table or Crosstab item, refer to the following articles: