A Dashboard is comprised of dashlets – individual items that are added to the dashboard. These may include Ad-Hoc views (chart, table or crosstab), Reports, Text, Webpages or images.
A Dashboard can include input controls for choosing the data displayed in one or more dashlets.
A Dashboard allows you to view multiple ad-hoc views or reports in a single, integrated view.
Instructions
Step 1. Open or Create a new Dashboard (refer to the Creating Dashboards articles for further information.
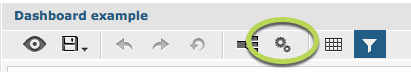
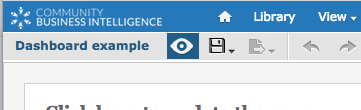
Step 2. Click the Properties icon at the top of the window
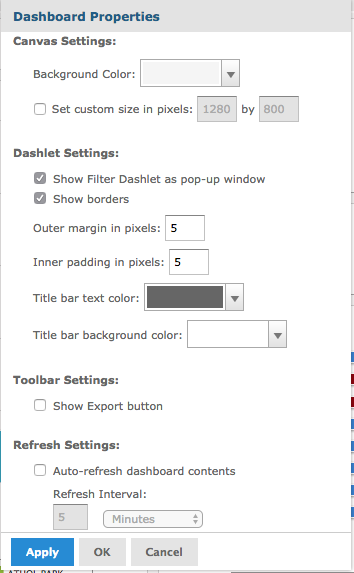
Step 3. View the available properties
Step 4. Edit the properties as required
Canvas Settings
Canvas settings let you change how the overall dashboard looks.
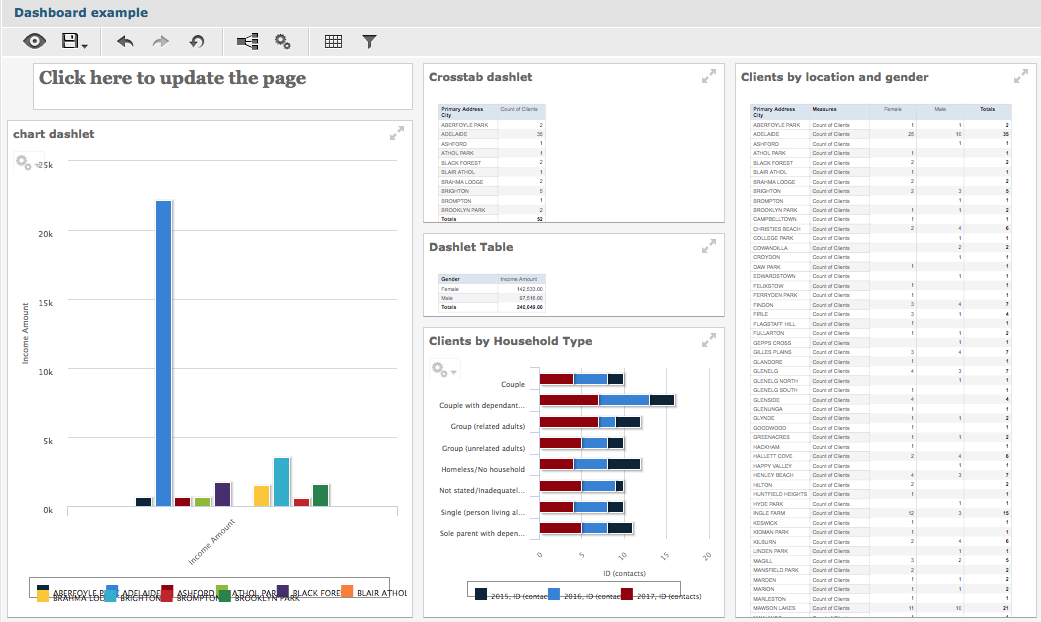
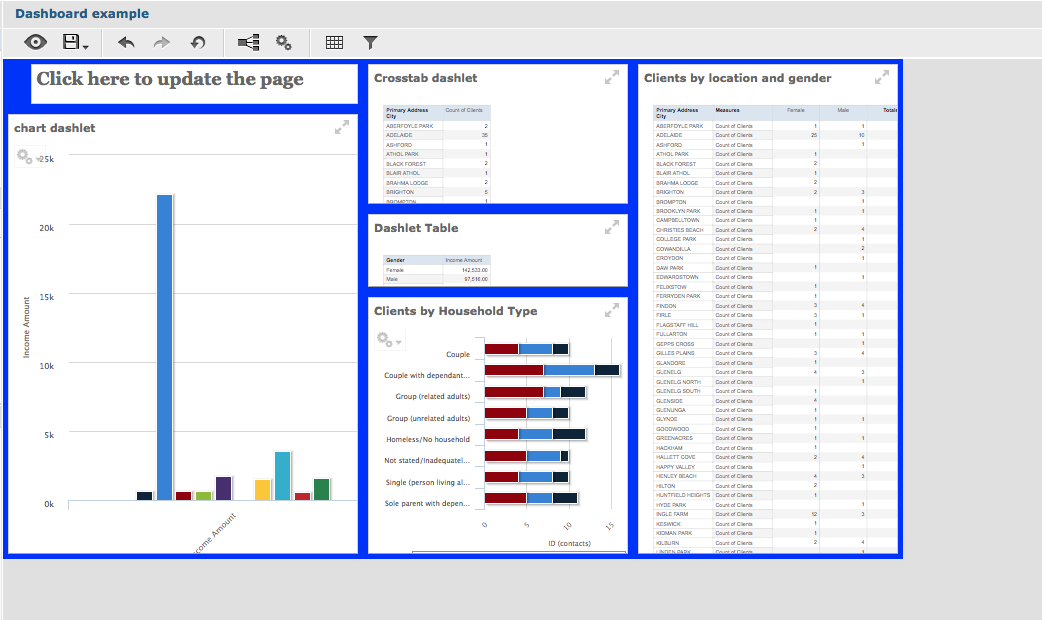
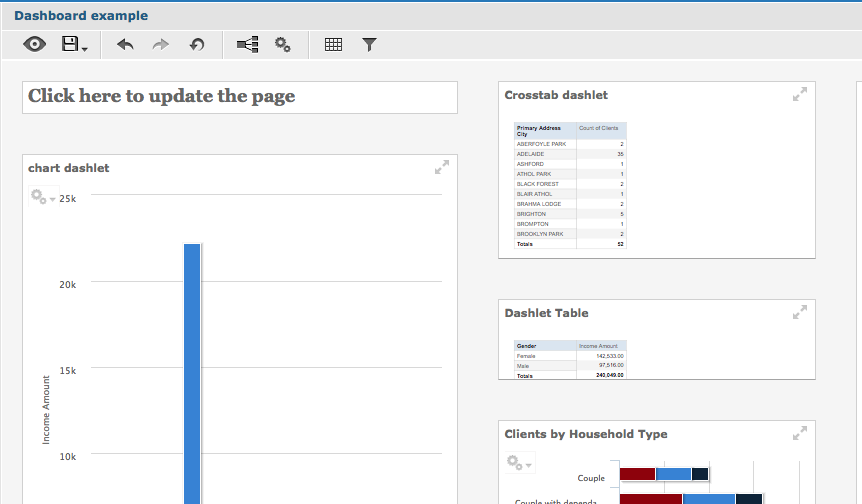
Dashboard view before any changes:
– Background Colour.
The background colour option allows you to set the colour behind your dashlets.
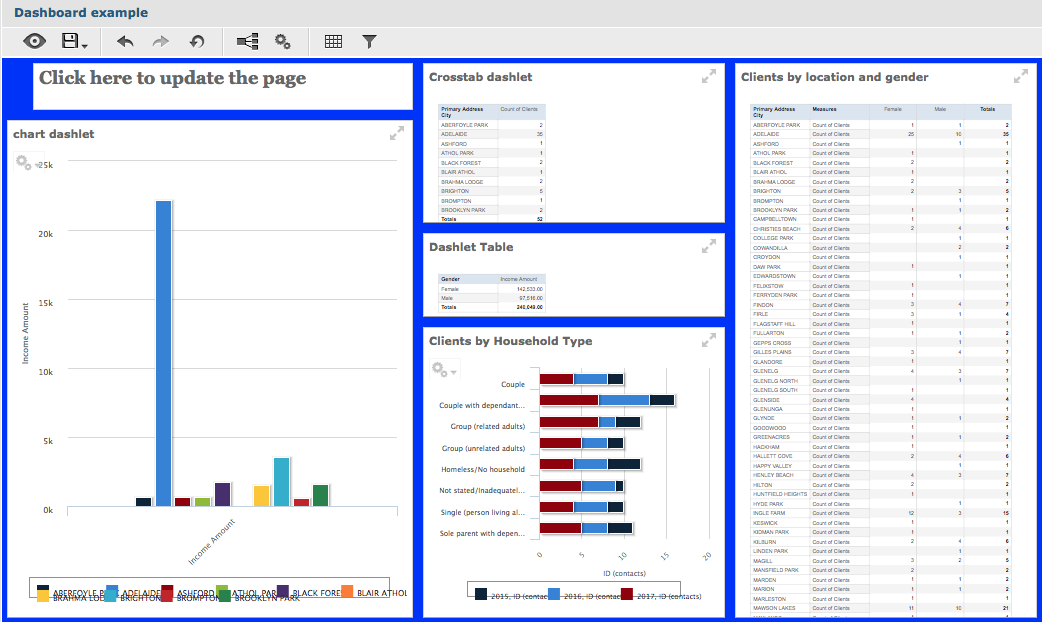
The background colour in the example below has been changed to blue.
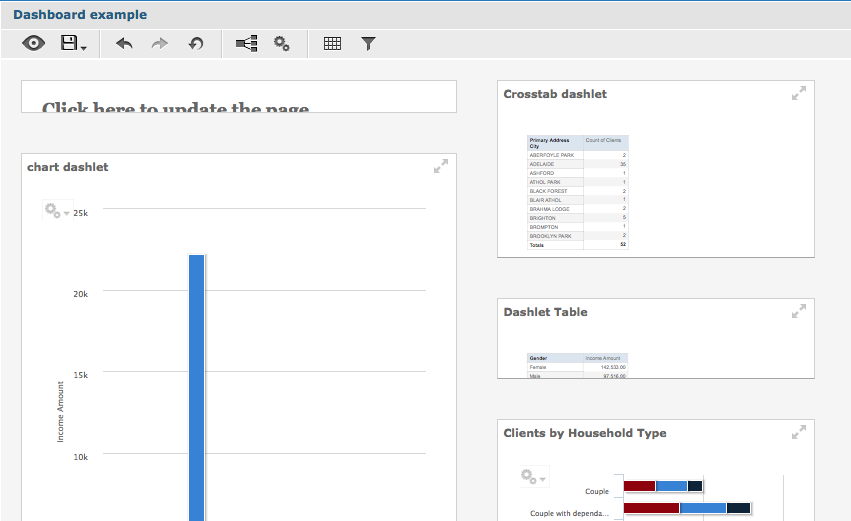
– Set Custom Size
Custom size lets you set the overall size of your dashboard. The size of the dashboard below has been decreased.
Dashlet
Dashlet settings let you change the settings for the dashlets contained within the dashboard
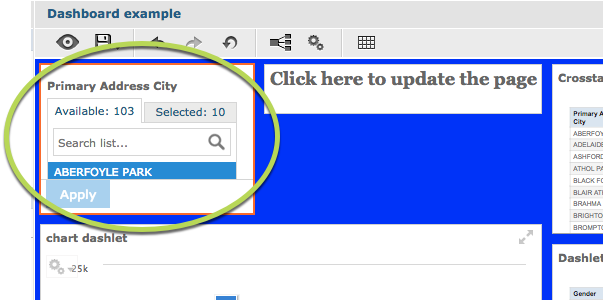
– Show Filter Dashlet
Selecting Filter Dashlet displays the filter as a pop-up window rather than a dashlet.
The filter dashlet is displayed as a dashlet below:
– Show Borders
Selecting Show Borders displays borders around each dashlet
Example with no borders displayed:
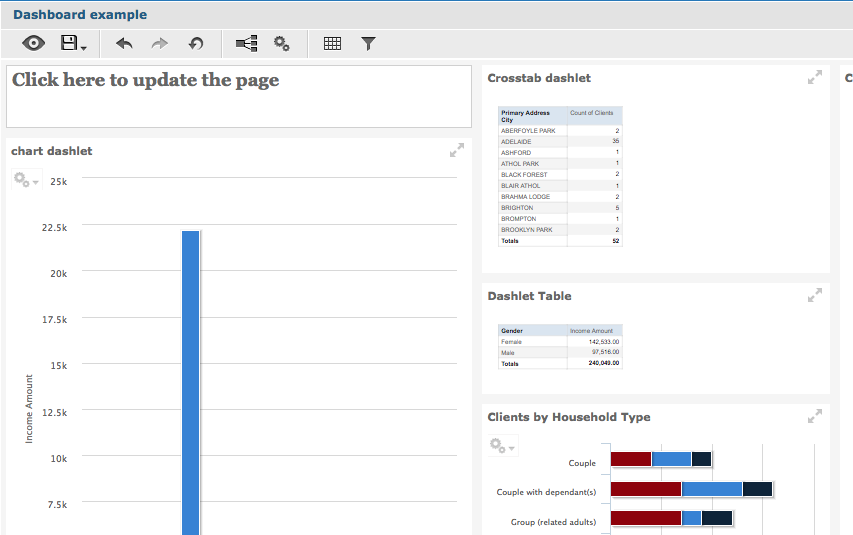
Example with borders displayed:
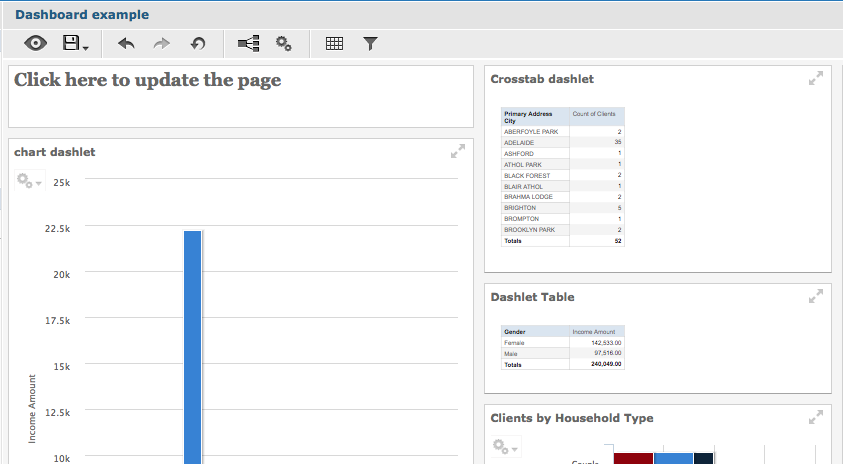
– Outer margin
Sets the amount of space around the outside of each dashlet.
The following example shows increased space around each dashlet.
– Inner padding
Sets the amount of space between the dashlet content and the dashlet borders.
The following example shows increased padding between the content and the edges of the dashlets.
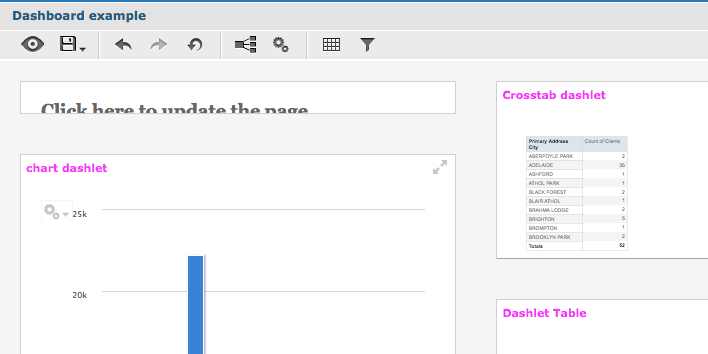
– Title Bar Text Colour
Sets the colour of the dashlet title text.
The following example shows dashlet titles with changed text colour.
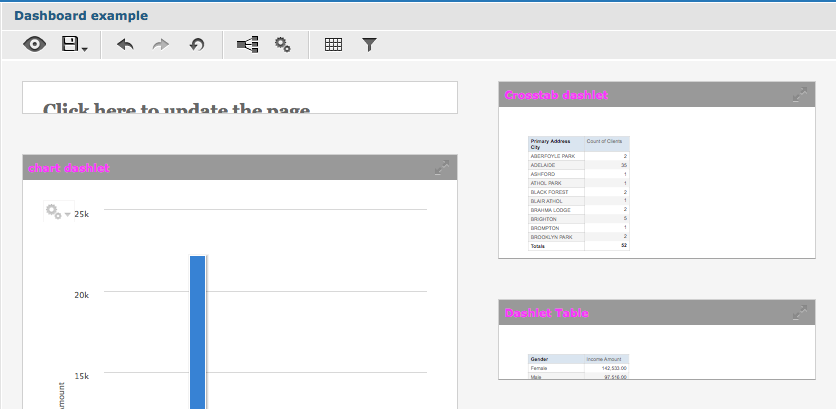
– Title Bar Background Colour
Sets the colour behind the dashlet title text.
The following example displays dashlet title bars with changed background colour.
Toolbar
Allows you to change the display of the toolbar
– Show Export button
Allows to choose whether the export button is displayed when in display mode.
In the example below the export button is visible when the dashboard is in display mode.
Refresh
The refresh option lets you determine when or if the dashboard refreshes when open
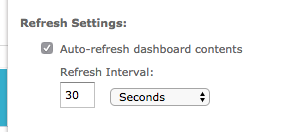
– Auto-refresh content
Allows you to choose to automatically refresh the returned data when the dashboard is open.
– Refresh Interval
Allows you to choose how often the data is refreshed, if auto-refresh is selected.
The following shows the settings required to automatically refresh the dashboard every 30 seconds.
Step 5. Click Apply to view the changes in your dashboard window.
Step 6. Click OK to close the Properties window, or Cancel to close the properties window and undo the applied changes.
Further Information
For information on adding a new Chart or Crosstab item, refer to the following articles: