A Dashboard allows you to view multiple ad-hoc views or reports in a single, integrated view.
A Dashboard is comprised of dashlets – individual items that are added to the dashboard. These may include Ad-Hoc views (chart, table or crosstab), Reports, Text, Webpages or images.
A Dashboard can include input controls for choosing the data displayed in one or more dashlets.
Instructions
Step 1. Open or Create a new Dashboard (refer to the Creating Dashboards articles for further information.
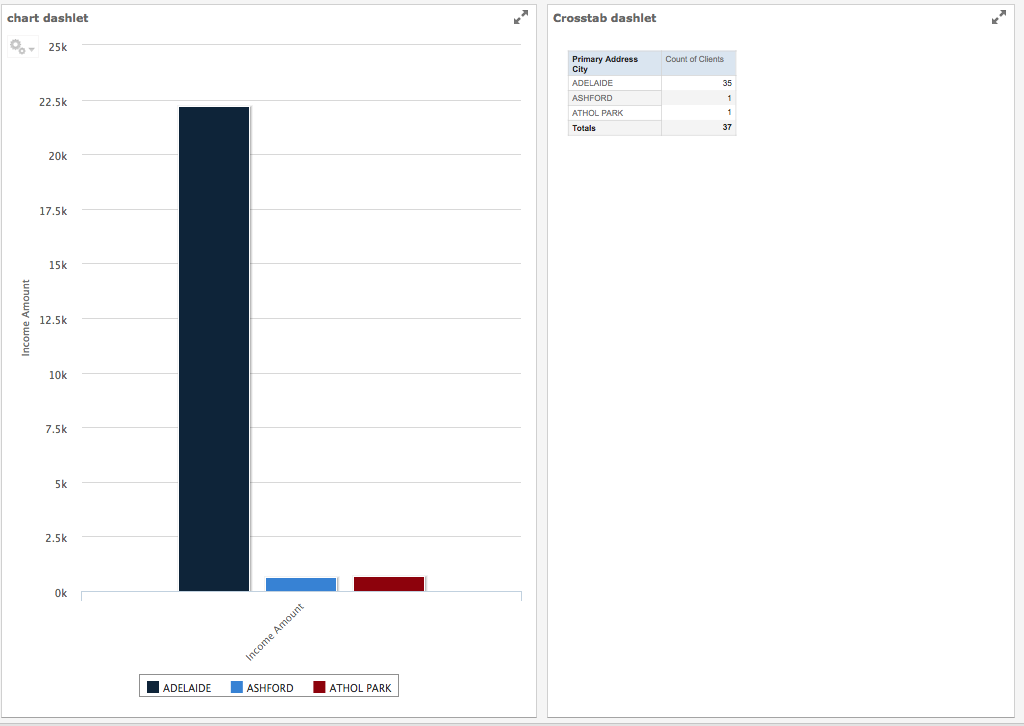
Step 2. Add Multiple Ad Hoc Views or reports to the dashboard.
For more information on adding Ad-Hoc Views to a dashboard, refer to the Creating Dashboards article.
Tip: To create a shared filter, the selected Ad Hoc Views must contain filters.
Step 3. Ensure filters have been created for the Ad Hoc Views or reports.
Step 4. If required, create filters for the items.
- Right Click on the item
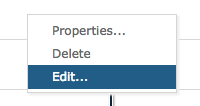
- Select Edit
- Right click on Field or Measure
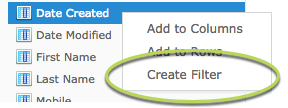
- Select Create Filter
- Configure the Filter as required
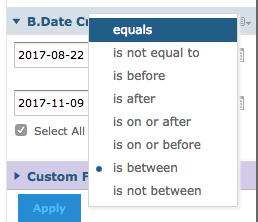
- Click Apply
- Save the item
For more information on creating filters, refer to the Ad Hoc View – Filters article.
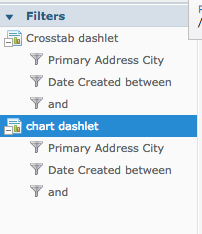
The filters will display in the filters area on the left-hand side pane.
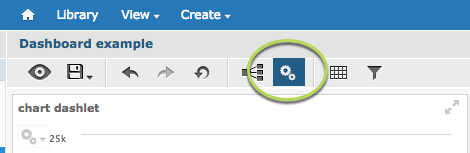
Step 5. Click the options icon at the top of the dashboard
Step 6. Select the check box for Show Filter dashlet as pop-up window
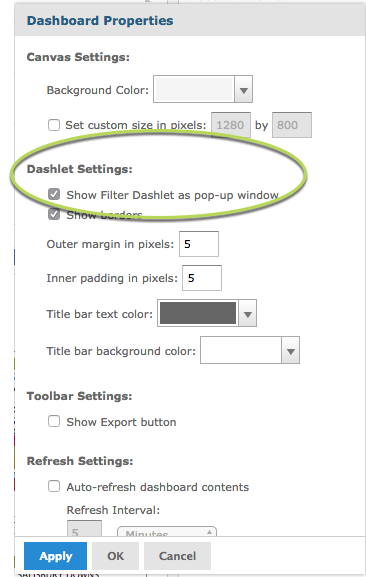
Step 7. Click Apply, OK
Step 8. Click the Filter Group icon at the top of the dashboard
Step 9. Click and drag filters from the filters pane to the filters group window
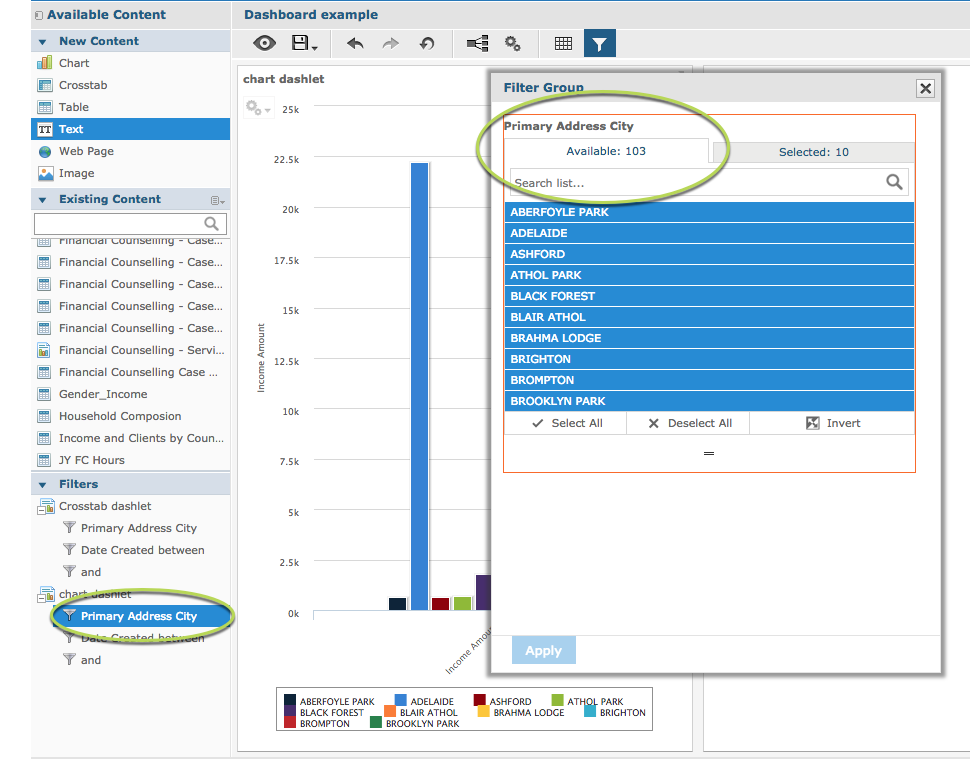
Tip: Where separate items have the same filter, only drag one version to the filter group
Step 10. Click Apply and close filter group window
Step 11. Click the Show parameter mapping dialog icon at the top of the dashboard
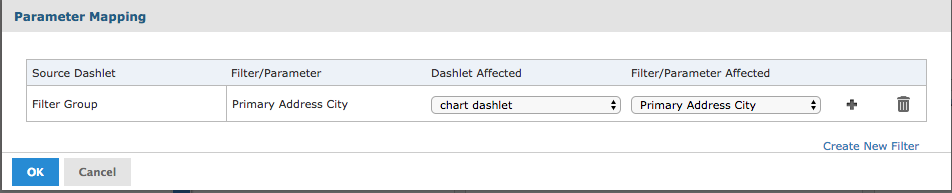
The parameter mapping window is displayed, the previously added filter is listed.
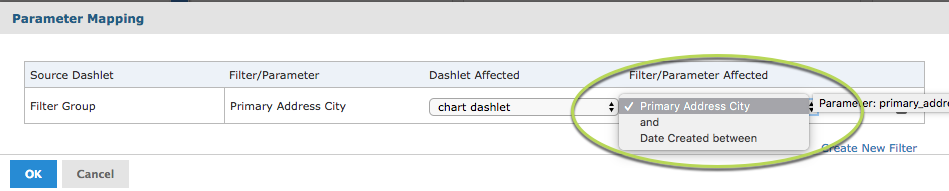
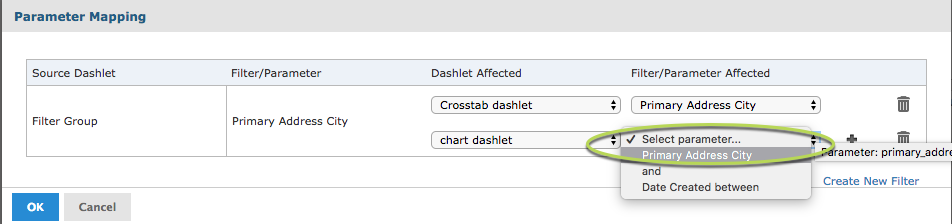
Step 12. Click the drop-down under Filter/Parameter Affected
All available filters for the listed Dashlet are displayed.
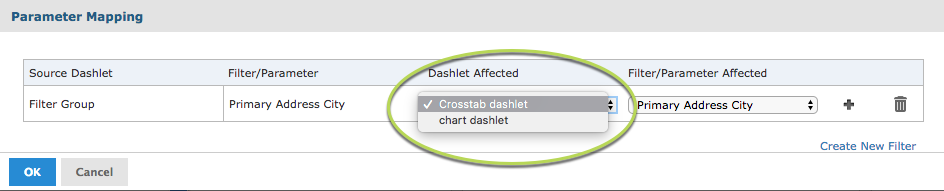
Step 13. Click the drop-down under Dashlet affected
All dashlets with the selected filter available are listed
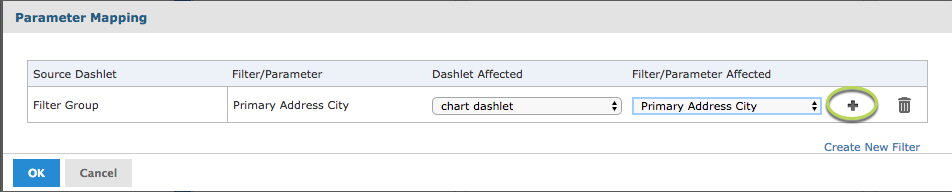
Step 14. To have the selected filter apply to multiple dashlets, click the plus icon
Step 15. Select the additional Dashlet Affected and Filter/Parameter Affected for the current Filter
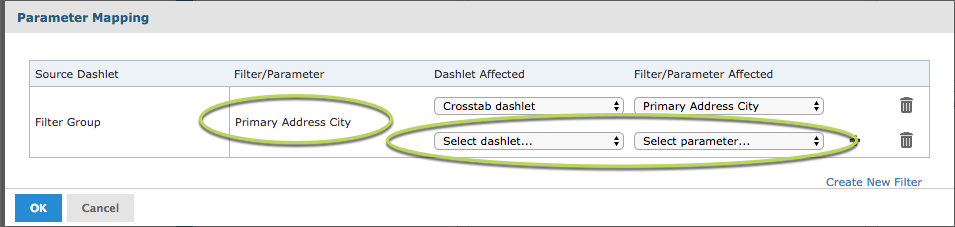
Select Dashlet Affected
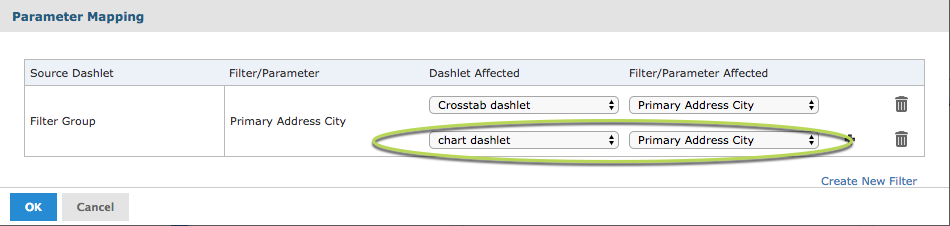
Select parameter to use for filter
Step 16. Click OK
The filter is applied to all selected dashlets
Step 17. Save the dashboard
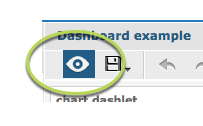
Step 18. Click the eye icon to view the display version
Step 19. Click the Filter Group icon and change the filter details
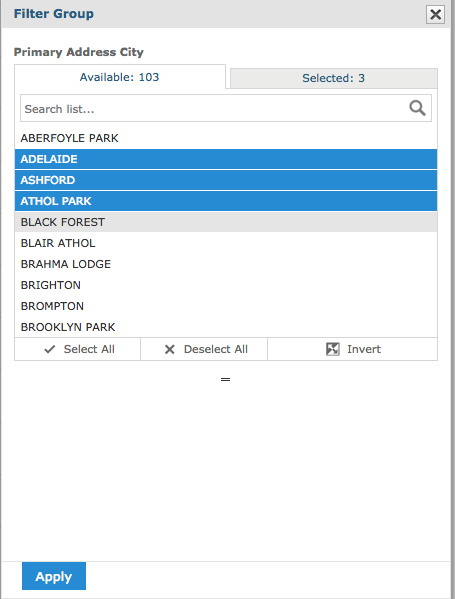
Step 20. Click Apply
Both dashlet results are updated
If you want the dashboard to be viewable and filterable from within your database, the configuration is slightly different.
Please refer to Dashboard – Configure Shared Filter for Database
Further Instructions
For more information refer to the following articles: