A Dashboard is comprised of dashlets – individual items that are added to the dashboard. These may include Ad-Hoc views (chart, table or crosstab), Reports, Text, Webpages or images. A Dashboard allows you to view multiple ad-hoc views or reports in a single, integrated view.
This article will concentrate on configuring table dashlet properties.
Instructions
Step 1. Open or Create a new Dashboard (refer to the Creating Dashboards articles for further information.
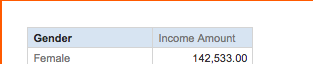
Step 2. Add or select a table from your dashboard.
Step 3. Right click on the table
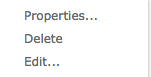
Step 4. Select Properties…
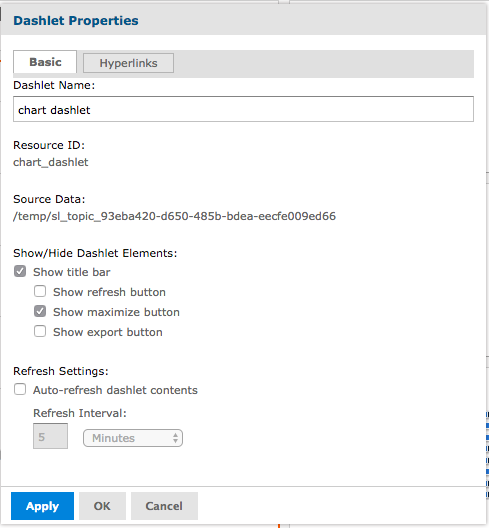
Step 5. Edit the properties as required
Dashlet Name: – To change the name that appears on the dashlet
- Edit the name to change what is displayed on the dashlet
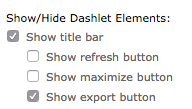
Show/Hide Dashlet Elements: – to enable or disable the following options:
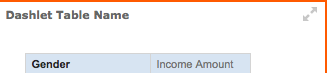
- Show title bar to show or remove the Name from the dashlet
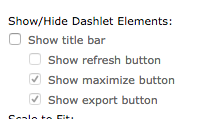
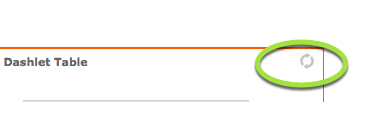
- Show refresh button to display a refresh button on the dashlet. This will allow you to update the dashlet while viewing.
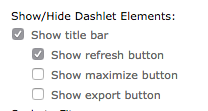
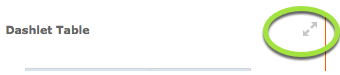
- Show maximize button to allow the maximizing of the dashlet when viewing
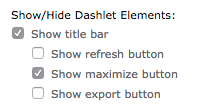
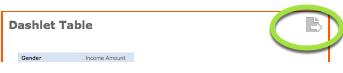
- Show export button to allow the exporting of the inividual dashlet contents
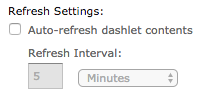
Refresh Settings: – To configure settings to automatically refresh the dashlet data while viewing
- Auto-refresh dashlet contents – to enable the automatic update of data
- Refresh Interval: – to configure the time to refresh
Step 6. Select the Hyperlinks tab
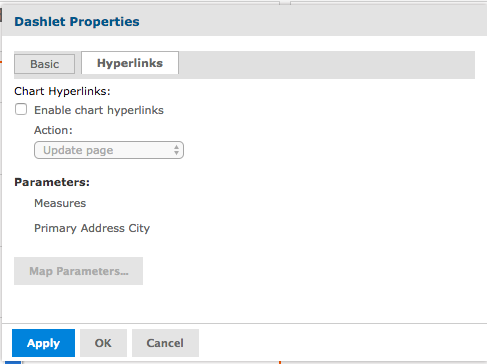
Click Enable chart hyperlinks to view options
a) Select ‘Update page’ option to refresh the page when clicking on the chart.
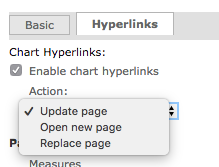
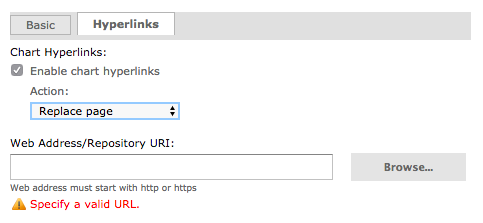
b) Select ‘Replace page’ option and enter a valid URL to move to a the new website when clicking on the chart.
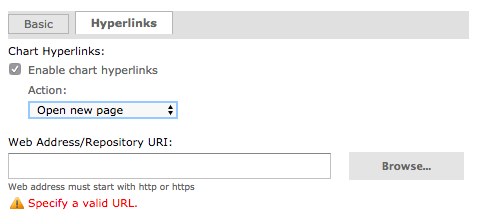
c) Select ‘Open new page’ option and enter a valid URL to open the entered webpage in a new tab when clicking on the chart.
Step 7. Click Apply to see the changes (you may need to drag the Properties window across your screen)
Step 8. Click OK if you wish to keep the changes and exit the Window, or click Cancel to revert to the original properties.
Further Information
For further information refer to the following articles: