A Dashboard allows you to view multiple ad-hoc views or reports in a single, integrated view.
A Dashboard is comprised of dashlets – individual items that are added to the dashboard. These may include Ad-Hoc views (chart, table or crosstab), Reports, Text, Webpages or images.
A Dashboard can include input controls for choosing the data displayed in one or more dashlets.
Instructions
Step 1. To create a new Dashboard either:
a) Click Create under the Dashboards section
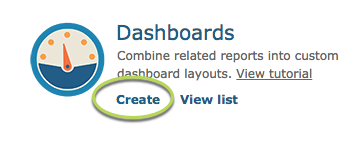
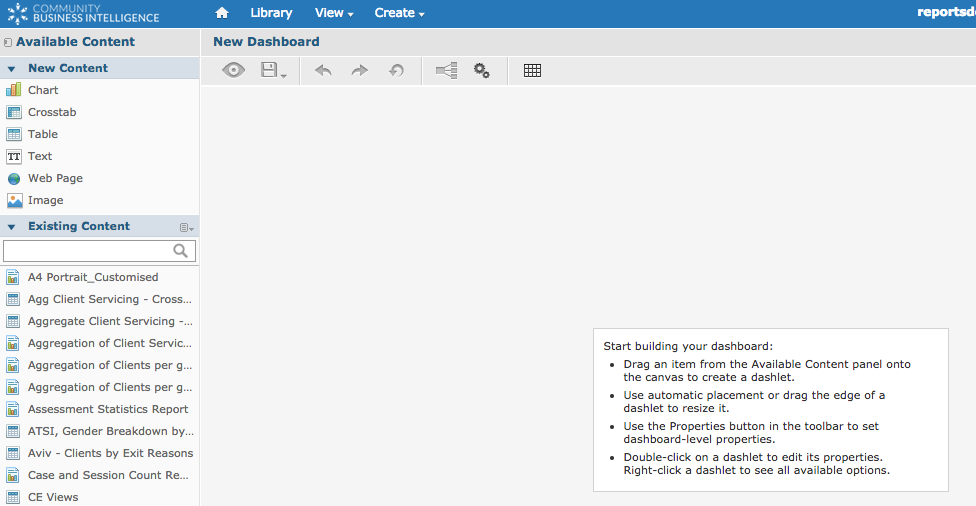
You will be taken to the Dashboard designer window
OR
b) Click Create in the top menu
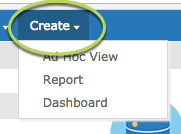
Select Dashboard
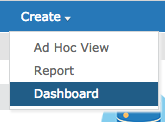
You will be taken to the Dashboard designer window
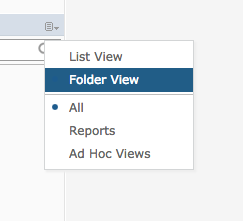
Step 2. Click on the menu button next to the Existing Content pane
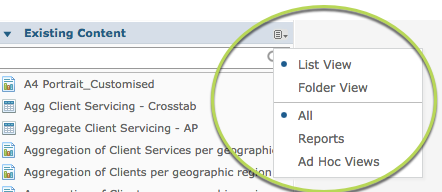
Step 3. Select Folder View
Step 4. Navigate to your required Ad-Hoc View or Report
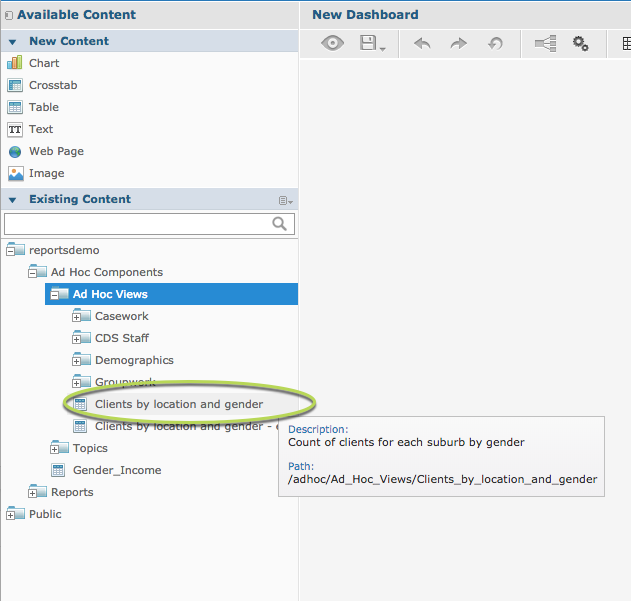
(Refer to Creating Ad-Hoc Views and Creating Reports for further information on how to create these items)
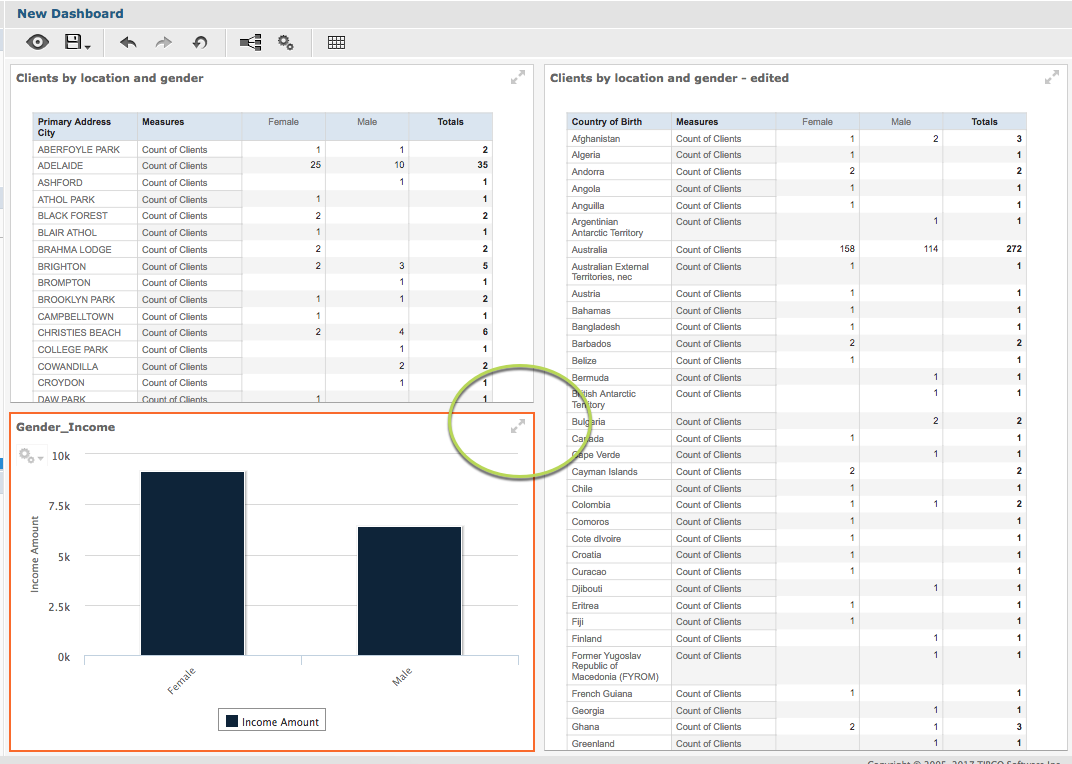
Step 5. Click and drag the item to the dashboard window
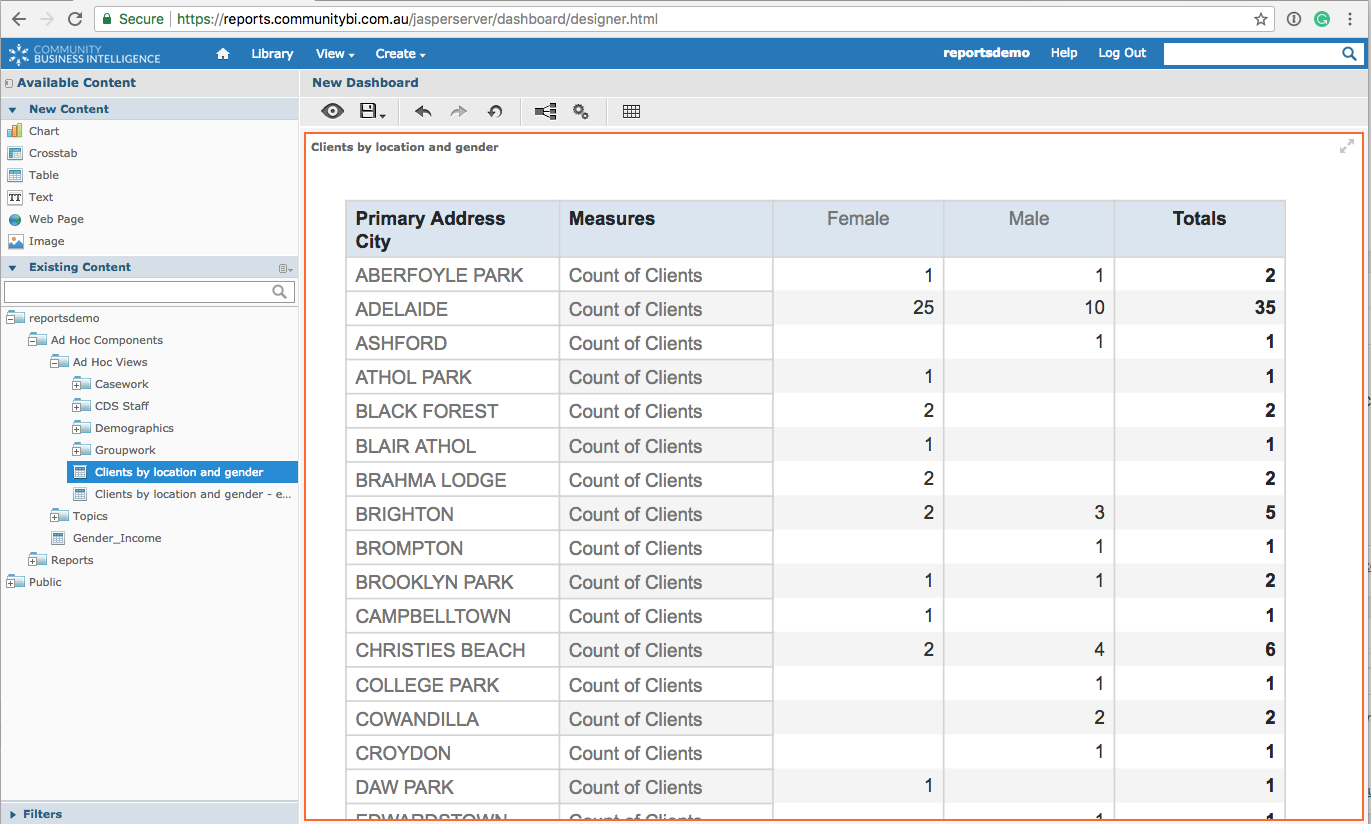
Step 6. Repeat process for other required items
Step 7. Resize the individual items by selecting the item and dragging the edges as required
Step 8. If you wish to create new content for the dashboard i.e. the Ad Hoc View or report you need does not exist, drag one of the items from the new content area to the dashboard window
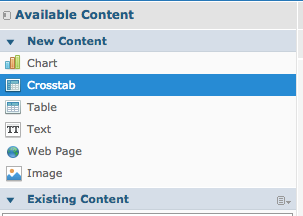
If the new content item is a Table, Chart or Crosstab, when you drag the item, you will be taken through the standard process for the creation of the Ad-Hoc View.
Refer to the following articles for further information:
- Dashboard – Creating New Table Content
- Dashboard – Creating New Crosstab Content
- Dashboard – Creating New Chart Content
Step 9. To save your dashboard, click the Save icon at the top of the window.
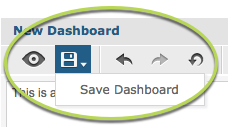
Step 10. Select Save Dashboard
The Save As window is displayed
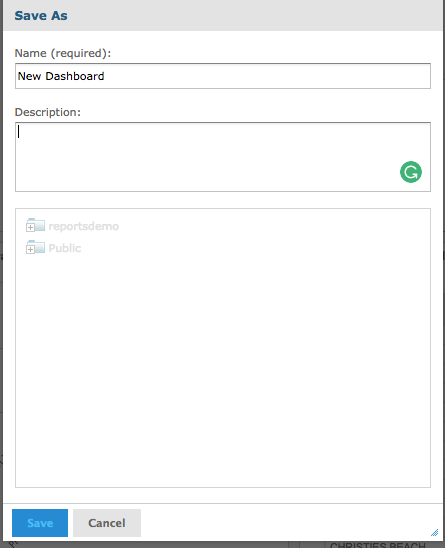
Step 11. Enter the required name, description and save location for your dashboard
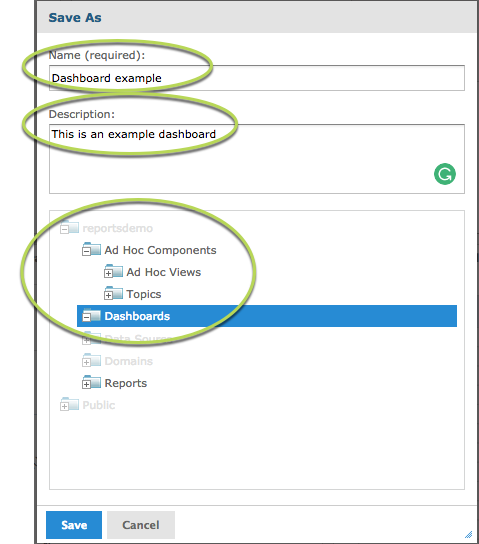
Step 12. Click Save
Further Information
For more information refer to the following articles: