When working with Ad Hoc Views it can be useful to filter data to concentrate on particular information. Other methods to filter data include adding a filter and selecting keep only or exclude in a crosstab view.
In Ad Hoc View Charts you can also choose to exclude particular measures from within the chart itself.
Ad Hoc Views allow you to visualise and analyse the data you capture for your organisation.
Ad Hoc Views can be viewed in the Community BI system or in reports and dashboard.
Instructions
Step 1. Create or open a Chart Ad Hoc View (refer to the Creating Ad Hoc Views article for further information).

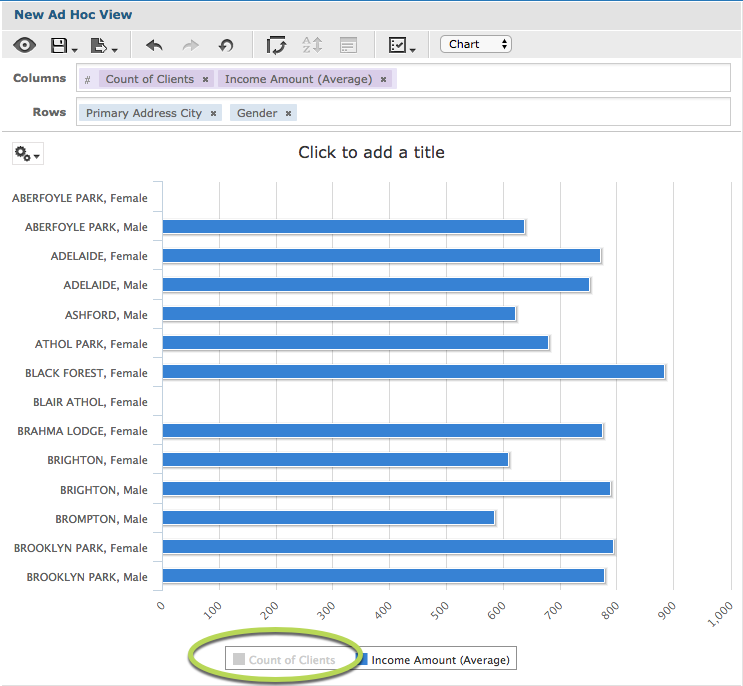
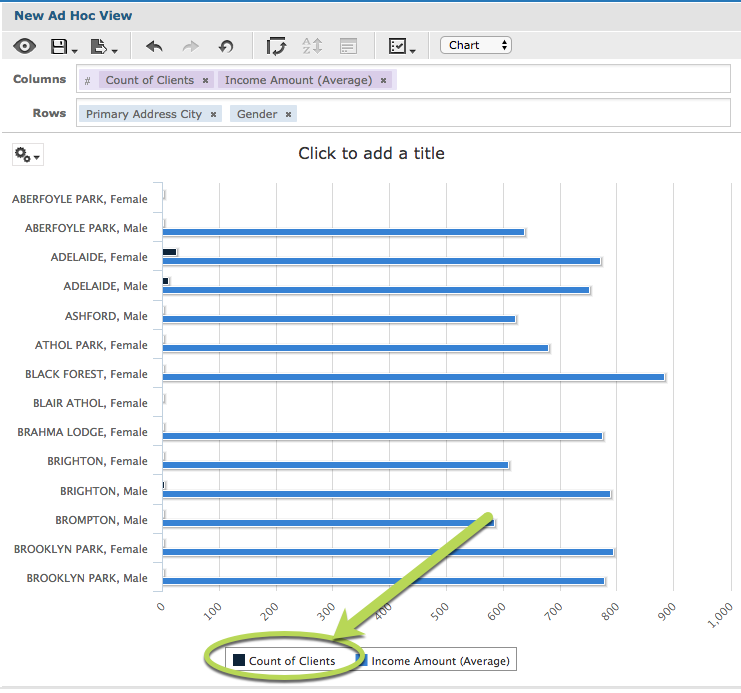
Step 2. Click on a measure name in the legend of the chart
The measure is removed from the chart and the name is greyed out in the legend.

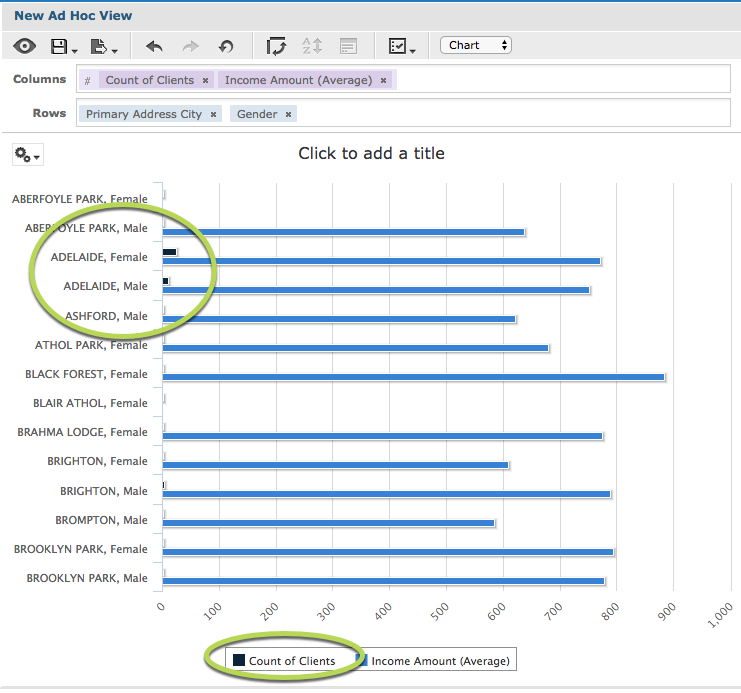
Step 3. To return the data, click on the greyed out measure name.

The measure is returned to the chart
Further Information
For further information please refer to the following articles:

